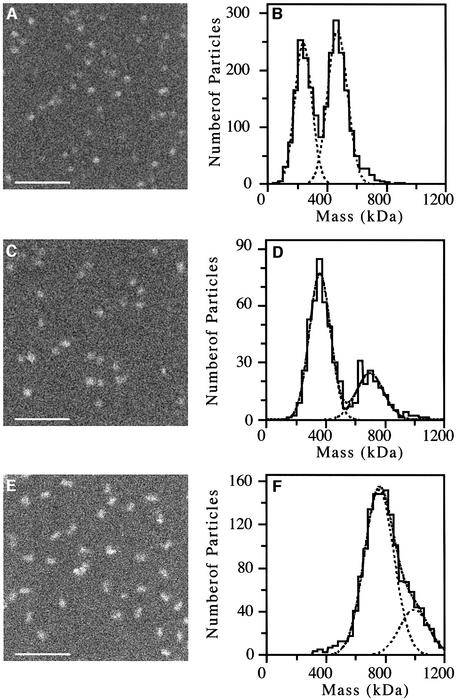
Fig. 3. STEM mass measurements. (A) Image of unstained McrBS particles. (B) Histogram showing the masses of the 2415 selected McrBS particles. The Gaussian curves fitted indicate two peaks with masses of 239 (± 57) and 468 (± 66) kDa. (C) Image of unstained McrBL particles. (D) Histogram showing the masses of the 572 selected McrBL particles. The Gaussian curves fitted indicate two peaks with masses of 361 (± 71) and 698 (± 93) kDa. (E) Image of unstained McrBLC particles. (F) Histogram showing the masses of the 1518 selected McrBLC particles. The Gaussian curves fitted indicate a main peak with a mass of 759 (± 100) kDa. An additional smaller peak with a mass of 994 (± 100) kDa was obtained. Correction has been made for beam-induced mass loss. Scale bars, 100 nm.

An official website of the United States government
Here's how you know
Official websites use .gov
A
.gov website belongs to an official
government organization in the United States.
Secure .gov websites use HTTPS
A lock (
) or https:// means you've safely
connected to the .gov website. Share sensitive
information only on official, secure websites.
