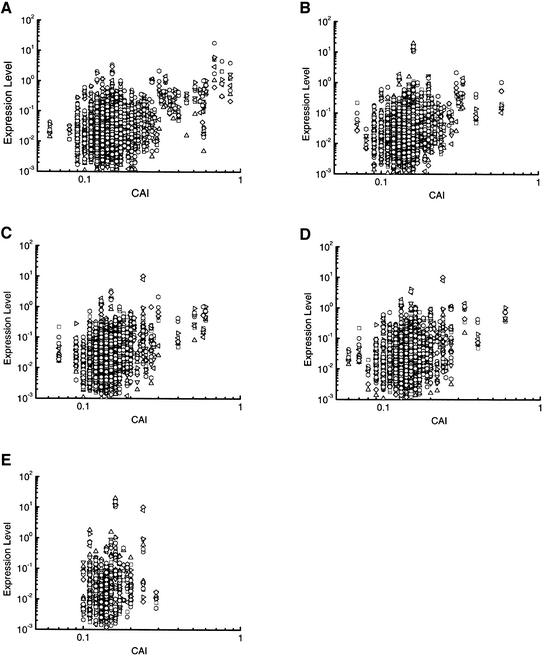
Fig. 2. Correlation of transcript expression level with the codon adaptive index (CAI) for up-regulated S.cerevisiae ORFs. The transcript levels for each ORF that was up-regulated following the physiological perturbations: (A) glucose up-shift (413 ORFs); (B) heat shock (319 ORFs); (C) stationary phase (99 ORFs); (D) hyper osmolarity (283 ORFs); and (E) ammonium starvation (284 ORFs) are plotted against the CAI for the ORF. Data points are the transcript levels for ORFs detected in the eight physiological conditions examined, YPGE (squares), glucose up-shift (circles), stationary phase (triangles), YNB-glucose 30°C (inverted triangles), ammonium starvation (wide diamonds), hyperosmolarity (right-facing triangles), YNB-glucose 23°C (left-facing triangles) and heat shock (narrow diamonds).

An official website of the United States government
Here's how you know
Official websites use .gov
A
.gov website belongs to an official
government organization in the United States.
Secure .gov websites use HTTPS
A lock (
) or https:// means you've safely
connected to the .gov website. Share sensitive
information only on official, secure websites.
