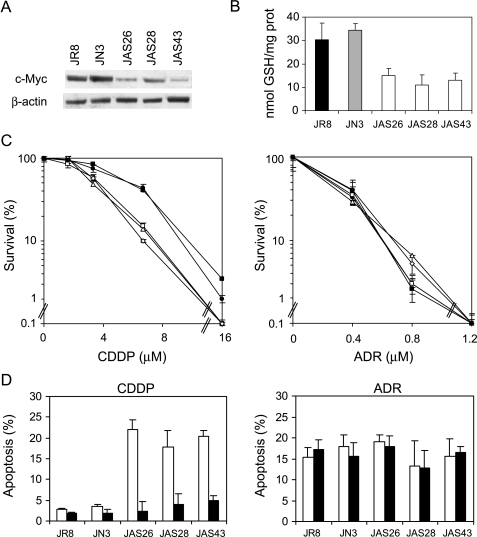
Figure 8.
Relationship among c-Myc, intracellular GSH content, and alkylating agent-induced apoptosis in the JR8 melanoma cells. (A) Western blot of c-Myc protein expression and (B) intracellular GSH content performed in the JR8 melanoma cell line, JN3 control clone, and JAS26, JAS28, and JAS43 c-Myc low-expressing clones (P < .05 calculated for all c-Myc antisense transfectants when compared to both control cells). (C) Survival curves of JR8 (●), JN3 control clone (■), JAS26 (□), JAS28 (◊), and JAS43 (△) c-Myc antisense transfectants exposed to increasing doses of either CDDP (left panel, P < .05 at 3.4 and P < .01 at 6.7 and 16 µM, calculated for all c-Myc antisense transfectants when compared to both control cells) or ADR (right panel). Surviving fractions were calculated as the ratio of the absolute survival of the treated sample/absolute survival of the untreated one. (D) Percentage of apoptotic cells evaluated 48 hours following the treatment with the IC50 doses of either CDDP (P < .01 calculated for all c-Myc antisense transfectants when compared to both control cells) or ADR, in both the unexposed (white bars) and GSH ethyl ester-exposed (black bars) JR8 parental line and JN3, JAS26, JAS28, and JAS43 transfectants.

