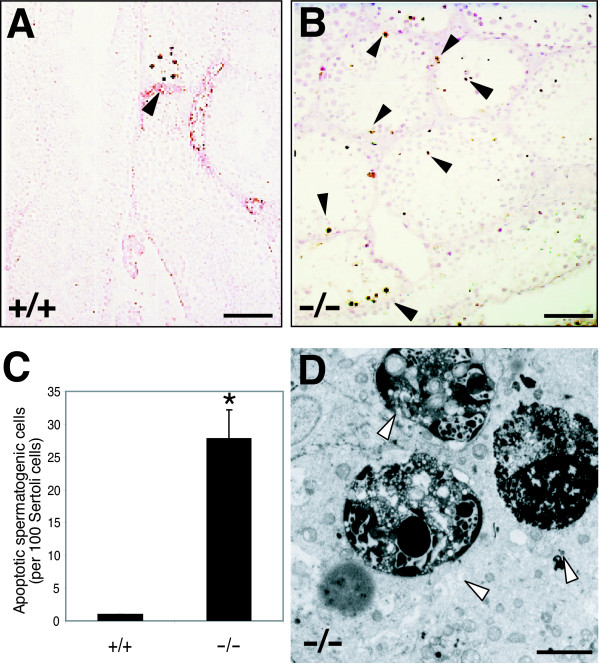
Figure 3.
Increased level of apoptosis in the gonads of Skp2-/- mice. (A, B) TUNEL staining of testicular sections of Skp2+/+ (A) or Skp2-/- (B) mice at 4 months of age. Arrowheads indicate apoptotic cells. Scale bars, 100 μm. (C) The number of apoptotic spermatogenic cells per 100 Sertoli cells. *P < 0.05 versus Skp2+/+. (D) Ultrastructural image of typical apoptotic figures (arrowheads) at late postmeiotic stages of spermatogenesis in a Skp2-/- mouse at 4 months of age. Scale bar, 5 μm.

