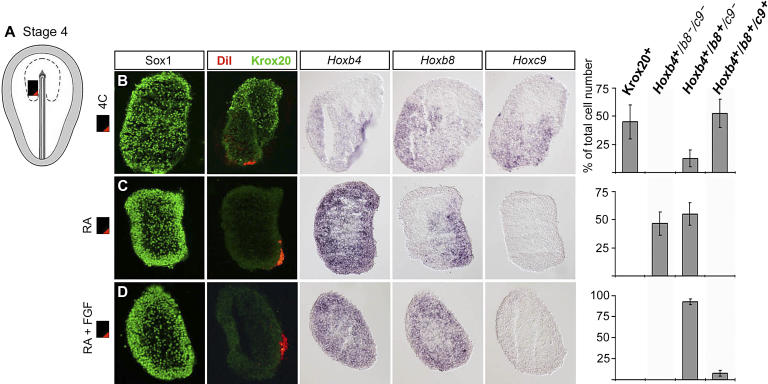
Figure 7. RA Induces cHB Cells, and RA and FGF, in Combination, Induce rSC Cells.
(A) Schematic drawing of a stage 4 embryo. Dotted line indicates the presumptive neural plate. Black box indicates caudal (C) neural plate explant isolated and cultured in vitro for 44 h. The red mark indicates the caudal margin of the explant labeled with DiI. Bars represent mean ± s.e.m. number of cells in Krox20 + Hoxb4 + /b8 −/c9 −, Hoxb4 +/b8 +/ c9 −, and Hoxb4 +/b8 +/c9 + domains, respectively, as percentage of total cell number.
(B–D) Each row represents consecutive sections from a single explant.
(B) Control stage 4 C explants generated Krox20 + cells in the rostral, and Hoxb4 +/b8 +/ c9 + cells were generated in the caudal region of the explant, adjacent to the DiI-labeled cells. A small domain of Hoxb4 +/b8 +/ c9 − cells was generated in the medial region but no domain of cells expressing Hoxb4 alone was generated ( n = 7 explants).
(C) RA (10 nM) blocked the generation of Krox20 + and induced Hoxb4 +/ b8 −/c9 −cells in the rostral region. Adjacent to the DiI-labeled cells in the caudal region of the explant, Hoxb4 +/b8 +/ c9 − cells, but no Hoxb4 +/b8 +/c9 + cells, were generated ( n = 6 explants).
(D) RA (10 nM) and FGF4 (30 ng/ml), in combination, generated Hoxb4 +/b8 + /c9 − cells in both the rostral and caudal regions. No, or a few, Hoxb4 +/b8 +/ c9 + cells appeared, and no Krox20 + or Hoxb4 + /b8 −/c9 − cells were generated ( n = 5 explants). Scale bar represents 100 μm.

