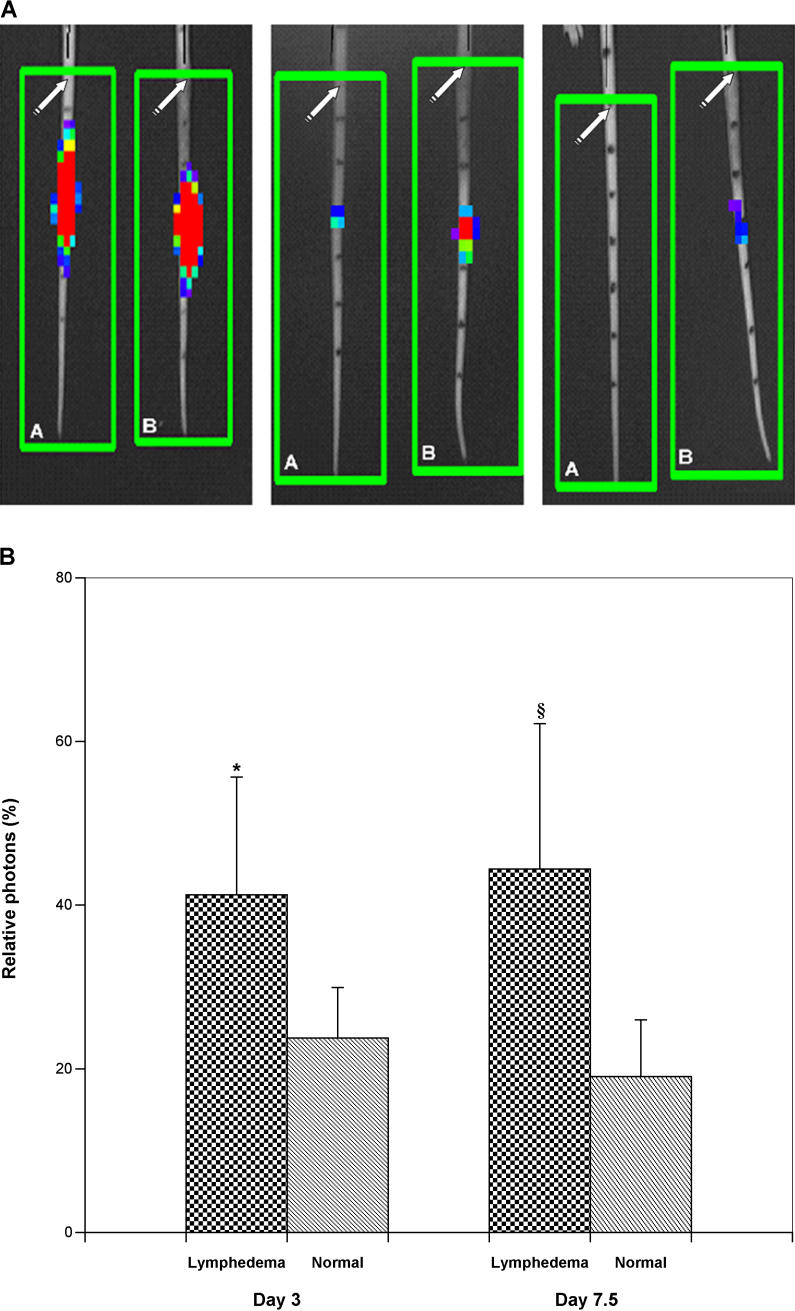
Figure 4. Dynamic Imaging of Immune Traffic in Experimental Lymphedema.
(A) In vivo bioluminescence imaging of immune traffic. Bioluminescence imaging was performed at defined time points following the introduction of luc + cells. This figure contains a representative series of imaging experiments for paired normal control (A) and lymphedema (B) mice. Photon densities range from red (high) to blue (low). In general, clearance of bioluminescent immunocytes from the lymphedematous tails was delayed, but remained unimpaired in the surgical sham controls. The left panel shows a perceptible increase in photon densities in lymphedema on day 3 post-injection (post-operative day 10). Within several days, the disparity in cellular clearance is even more evident (middle panel); as late as day 17 post-injection, there is still visible bioluminescence in the lymphedematous tail, while all activity has cleared from the normal tail (right panel). The original surgical site is depicted by the white arrows. The black marks on the tail denote 8-mm vertical distances; splenocyte injection was performed 24 mm below the surgical site.
(B) Quantitative assessment of in vivo bioluminescence imaging of immune traffic. Relative photon density, expressed as a percent of the observed value on day 1, was significantly greater in lymphedema than in normal controls, both at day 3 and at day 7 post-injection (*, p < 0.05; §, p < 0.02).

