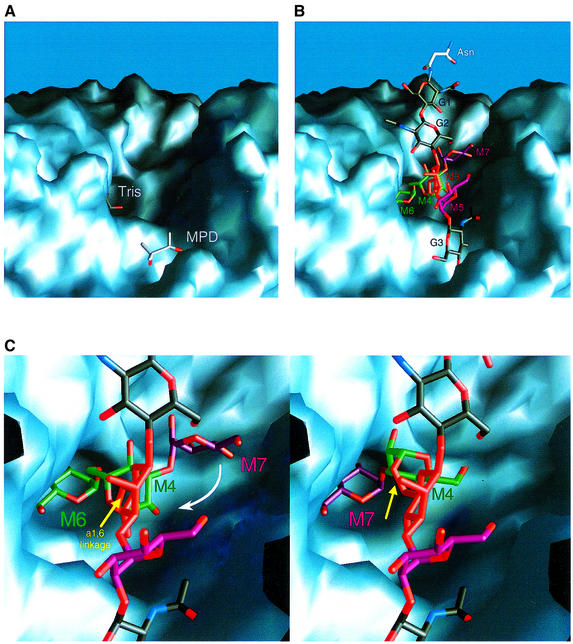
Fig. 4. (A) Molecular surface representation of dGMII showing the position of the active site-bound Tris molecule and the MPD-binding site. (B) Molecular surface representation of dGMII with the GlcNAcMan5GlcNAc2 substrate modeled into the binding pocket. The substrate molecule is positioned into the binding pocket with α1,6-linked mannose M6 (shown in green) docked into the active site and β1,2-GlcNAc residue G3 (shown in black) placed in the MPD-binding site. Individual mannose residues of the substrate are colored according to the coloring scheme used in Figure 1A. (C) Representation of the sequential trimming of the α1,6- (M6) and α1,3-linked (M7) mannose residues. All molecular surface images were produced using GRASP (Nicholls et al., 1991).

An official website of the United States government
Here's how you know
Official websites use .gov
A
.gov website belongs to an official
government organization in the United States.
Secure .gov websites use HTTPS
A lock (
) or https:// means you've safely
connected to the .gov website. Share sensitive
information only on official, secure websites.
