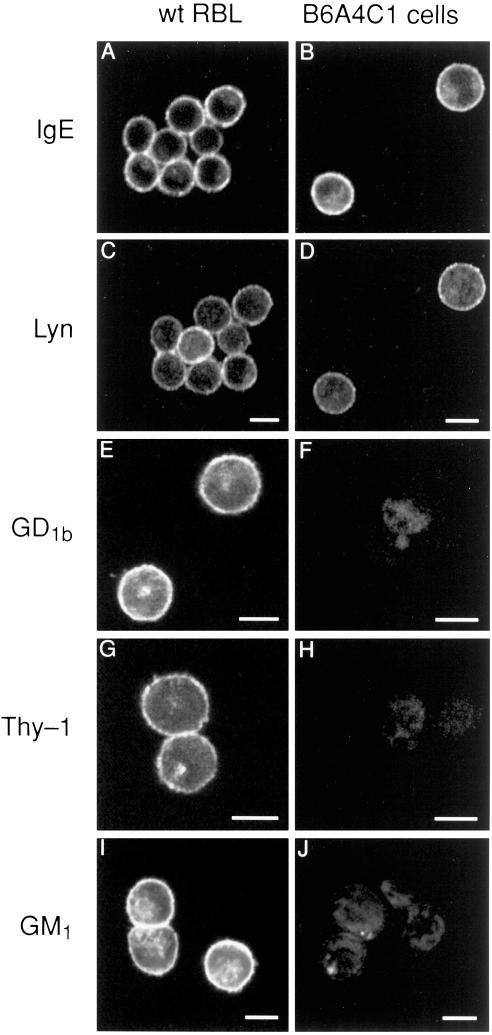
Figure 1.
Confocal fluorescence images of mutant B6A4C1 (right panels) and wild-type RBL-2H3 mast cells (left panels). Cells were sensitized with FITC-IgE (A-D) or unlabeled IgE (E-J), then fixed, permeabilized, and labeled as described in Methods. Cells with receptor-bound FITC-IgE (seen in A, B) were also labeled with rabbit anti-Lyn and Cy3-antirabbit secondary antibody (seen in C, D). Separate samples were labeled with Cy3-AA4 antiganglioside antibody (E, F), Cy3-anti-Thy-1 (G, H), or FITC-cholera toxin A specific for GM1 (I, J). Images shown are representative of at least 95% of the cells observed (>200 cells in two or more experiments for each marker). Scale bars = 10 μm.

