Figure 3.
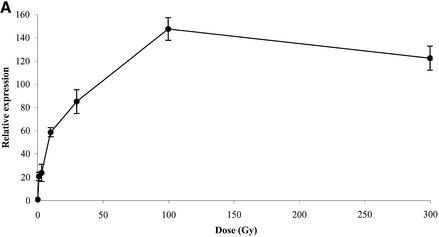
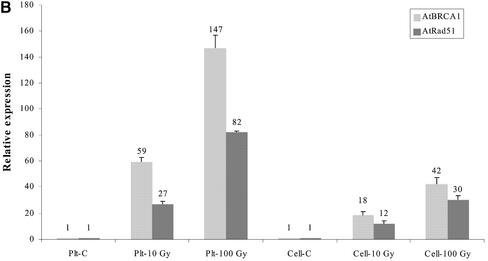
Quantification by real-time quantitative PCR of: (A) AtBRCA1 mRNA level determined 1 h after irradiation of plantlets with different doses; (B) AtBRCA1 and AtRAD51 mRNA levels in control (C) and irradiated samples (dose-Gy). Samples were 4-day plantlets (Plt) and cells suspensions (cell). All results are normalized to the unirradiated sample. Each quantification was done on two independent RNA extractions and reverse transcription reactions.


