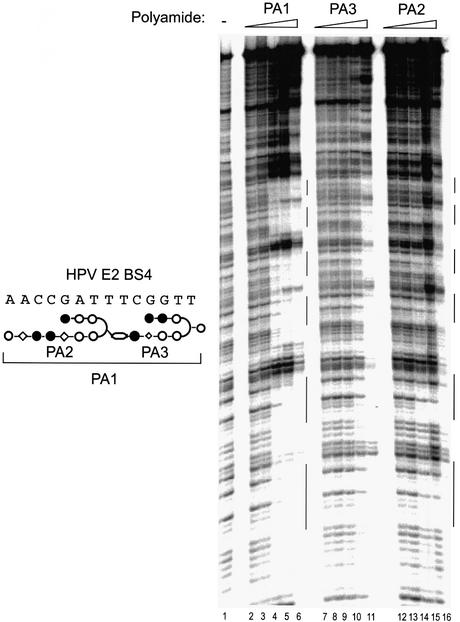
Figure 2.
Quantitative DNase I footprinting titrations with the tandem hairpin PA1 and its component single hairpin polyamides. The composite schematic relationship between these molecules is shown to the left of the autoradiogram. The footprinting analysis was performed on a DNA restriction fragment encoding six identical copies of the HPV-18 E2 binding site 4 (BS4) (18). Lane 1 contained no polyamide. The DNA was incubated with increasing concentrations of tandem hairpin PA1: 0.01 (lane 2), 0.1 (lane 3), 1 (lane 4), 10 (lane 5) and 100 nM (lane 6). Concentrations of polyamides PA3 and PA2 surveyed were 0.1 (lanes 7 and 12), 1 (lanes 8 and 13), 10 (lanes 9 and 14), 100 (lanes 10 and 15) and 1000 nM (lanes 11 and 16). Note that the concentration ranges tested for the tandem hairpin and single hairpins differ by an order of magnitude. Vertical bars on the right of the figures represent the six tandem BS4 sites.

