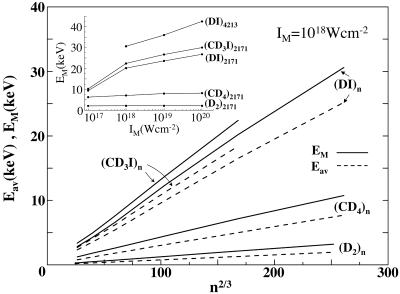
Fig. 3.
The cluster size dependence of the maximal energies EM (solid lines) and average energies Eav (dashed lines) of D+ ions in the uniform CE of (D2)n clusters and in the nonuniform CE of (CD4)n, (DI)n, and (CD3I)n clusters at I = 1018 W·cm−2 and τ = 25 fs. The simulation data manifest the (divergent) power law EM, Eav ∝ n2/3. Slight deviations from this scaling dependence for small (DI)n and (CD3I)n ECLHHs originate from ignition and screening effects for inner ionization (12). (Inset) The dependence of EM and IM for clusters marked on the curves.

