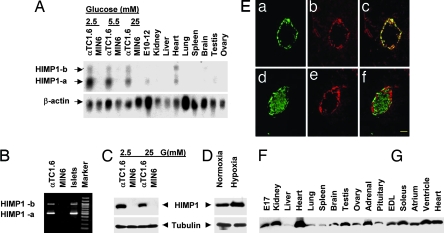
Fig. 1.
Contrasting tissue distribution and induction of expression by low glucose or O2 of the two HIMP1 gene products. (A) Northern blot. E10–12, 10- to 12-day embryos. (B) RT-PCR. The primer set (5′-GGGTTGTACAAGCTGAAGAG-3′, 5′-TGACACCCTCCCAAAGCATG-3′) is derived from the upstream and downstream regions beyond the 499 internal nucleotides of the HIMP1-b cDNA. HIMP1-a (500 bp) and HIMP1-b (999 bp) are shown. (C and D) Immunoblot analysis of HIMP1 level inducible at low glucose (C) or 5% O2 hypoxia (D) for 24 h; 50 μg of protein per lane. (E) Double immunofluorescent detection of HIMP1 (b and e) with glucagon (a) or C-peptide (d) in mouse pancreatic islets. (c and f) Merged images of a and b and d and e, respectively. (Scale bar, 50 μm.) (F and G) Immunoblot analysis of HIMP1 level in various tissues; 50 μg of protein per lane. E17, 17-day embryo. EDL, extensor digitorum longus muscle.

