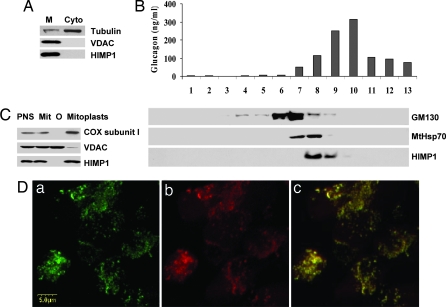
Fig. 2.
Analyses of HIMP1 subcellular localization. (A) Immunoblot. M, membrane; Cyto, cytosol; 50 μg of protein per lane. (B) RIA of glucagon and immunoblot analyses of proteins (GM130, MtHsp70, and HIMP1) in 13 fractions of αTC1.6 cells separated by sucrose gradient centrifugation. (C) Immunoblot. PNS, postnuclear supernatant; Mit, crude mitochondrial fraction; O, outer membrane fraction; mitoplast, inner membrane and matrix. (D) Confocal immunofluorescence staining. (a) HIMP1. (b) Cox subunit I. (c) Merged image of a and b.

