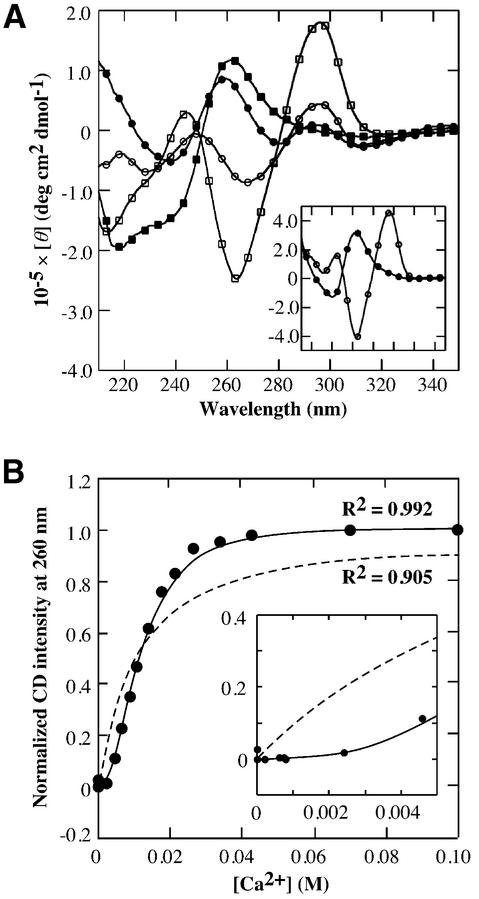
Figure 1.
Equilibrium analysis of the transition from the antiparallel to the parallel G-quadruplex. (A) CD spectra of 25 µM d(G4T4G4) (squares), d(G3T3G3) (circles) and d[(G4T4)3G4] (circles in the inset) in a buffer containing 100 mM NaCl, 50 mM MES (pH 6.1) with (filled symbols) or without 100 mM CaCl2 (open symbols) at 5°C. (B) Plot of normalized CD intensity d(G4T4G4) at 260 nm versus Ca2+ concentration at 5°C. Dotted and stick lines indicate best-fit results for the data with the following equations: (normalized CD intensity at 260 nm) = Ka[Ca2+]/(1 + Ka[Ca2+]) and (normalized CD intensity at 260 nm) = Ka[Ca2+]n/(1 + Ka[Ca2+]n), respectively. The best fitted value for n is calculated to be 2.11.

