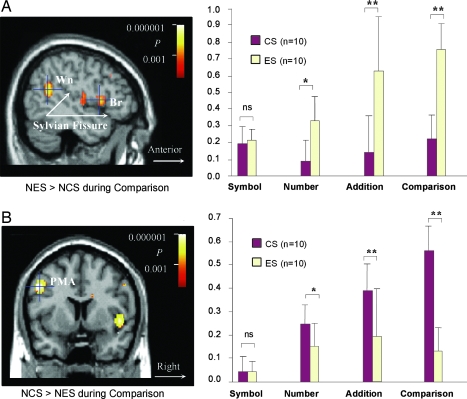
Fig. 2.
Comparison of the activation intensity between NCS and NES in the perisylvian language region (A) and the PMA (B). The brain activation maps (Left) were determined by contrasting BOLD signal between NCS and NES only during the Comparison task, with the NES group showing relative increase of the signal (A, English > Chinese) and the NCS group showing relative increase of the signal (B, Chinese > English). The within-group task-dependent activation was determined by spm99 by using a threshold (P < 0.001, uncorrected) for defining the ROIs in the perisylvian language region, including both the Broca area (Br) with Talairach coordinates at (−50, 12, 7) and Wn (−57, −59, 16), and in the PMA (−18, 22, 56). For each individual, the fMRI activation index (Right) was then determined by integrating the BOLD signal changes in these ROIs for statistical comparisons. Two-sample t tests were used to compare the mean of the activation index for each task. ∗, P < 0.05; ∗∗, P < 0.01; ns, no significance (n = 10).

