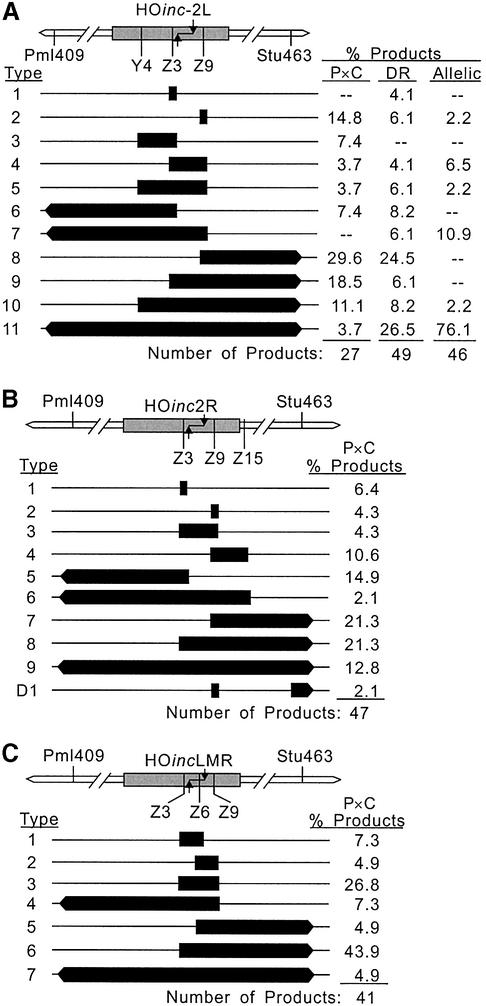
Figure 3.
High resolution tract spectra. (A) HOinc2L tract spectrum. The HOinc2L sequence within ura3 is shown by the shaded box, with mutations indicated below. The flanking RFLPs (Pml409 and Stu463) are also indicated. Black bars indicate converted markers; bars with arrowheads indicate tracts that reached Pml409 or Stu463 and may or may not extend to more distant RFLPs. The percentage of each tract type is listed for P × C, direct repeat (DR), and allelic recombination substrates. (B) HOinc2R tract spectrum (P × C only). (C) HOincLMR tract spectrum (P × C only).

