Figure 3.

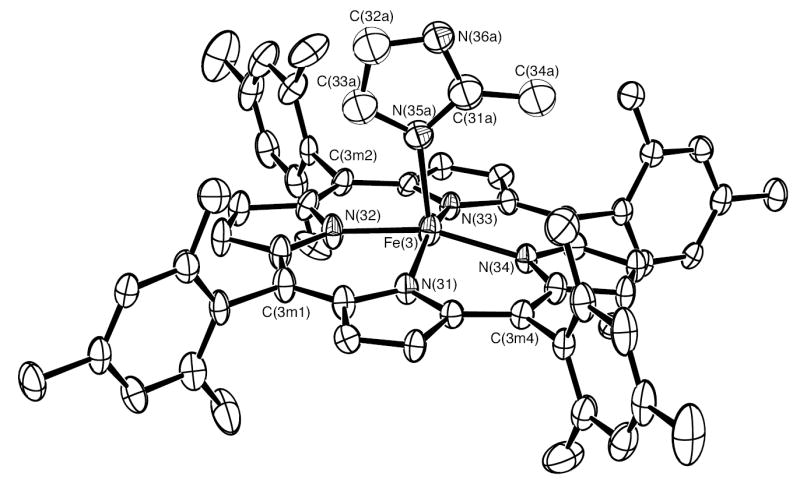
ORTEP diagram of [Fe(TMP)(2-MeHIm)] (mol 3). Only the major orientation (55%) of the imidazole ligand is shown. The hydrogen atoms have been omitted for clarity; 50% probability ellipsoids are depicted.

ORTEP diagram of [Fe(TMP)(2-MeHIm)] (mol 3). Only the major orientation (55%) of the imidazole ligand is shown. The hydrogen atoms have been omitted for clarity; 50% probability ellipsoids are depicted.