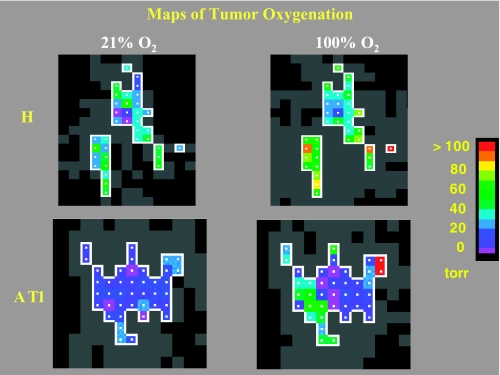
Figure 1.
pO2 maps obtained using FREDOM. Distinct xheterogeneity was seen in these representative small H (1.1 cm3) and AT1 (1.5 cm3) tumors under baseline conditions, when the anesthesized rats breathed air. The H tumor [baseline mean pO2=20.3 ± 2.2 (SE) Torr] was significantly better oxygenated than the AT1 tumor (baseline mean pO2=5.3 ± 0.9 Torr, P<.001). In response to oxygen inhalation, pO2 increased significantly in both the H and the AT1 tumors [mean pO2=46.7 ± 3.7 Torr (P<.001) and 17.2 ± 3.8 Torr (P<.005), respectively]. In each case, the fourth measurement after switching to oxygen breathing is shown. Colored voxels were selected by applying threshold criteria to each ensuring high-quality data throughout the time course. Gray voxels provided a T1 curve fit, but with large errors.

