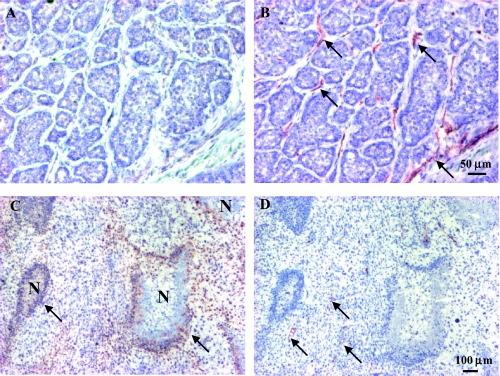
Figure 5.
Distribution of pimonidazole and CD31 in representative large H and AT1 tumors (A) Well-differentiated H tumor comprising multiple glandular structures and connective stroma. Immunostaining for hypoxia marker, pimonidazole showed few positive cells. (B) Anti-CD31 staining (brown) demonstrated relatively welldistributed vascular endothelial cells in a consecutive 6-lm section. (C) The anaplastic AT1 tumor is composed of nonglandular structure and fewer stromal cells. Typical distribution of hypoxia in the AT1, recognized as positive staining for pimonidazole (brown), was observed at some distance from blood vessels stained for CD31 (D, arrow) and located adjacent to necrotic regions (N).

