
Figure 2.
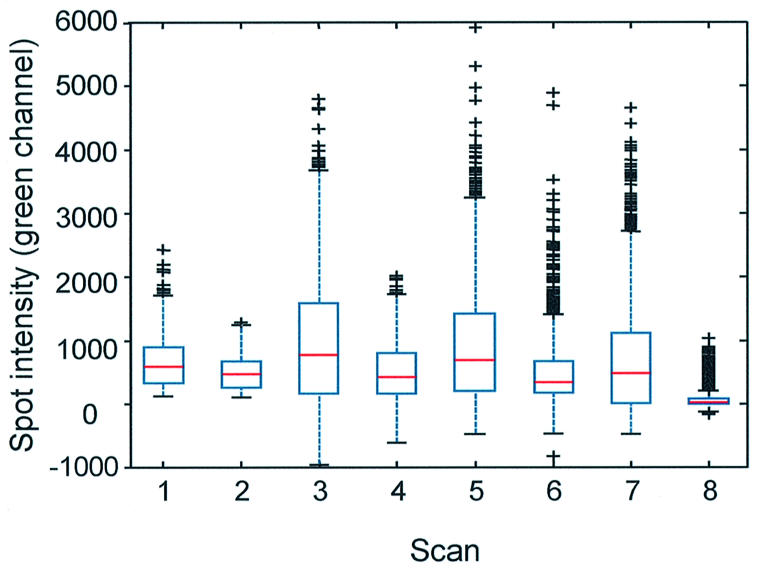
Spot-localized, contaminating fluorescence in the green channel on commercially printed arrays is highly variable and incompletely removed after mock-hybridization. Shown are box-plots of contaminating fluorescence intensities after background subtraction. One OpArray slide (Operon) (with 450 spots) was scanned before (scan 1) and after (scan 2) mock- hybridization. Two slides (Corning) (with 6174 spots, from lot 28300001) were analyzed before (scans 3 and 5) and after mock-hybridization (scans 4 and 6). One slide (Corning) from lot 27600002 was scanned before (scan 7) and after (scan 8) mock-hybridization. The upper and lower lines of one box indicate the 25th and 75th percentile, respectively, of the sample of spot intensities for one slide scan. The red line within the box indicates the sample median. The extent of the lines above and below the box indicate the upper and lower limits of the sample except for outliers, which are indicated by crosses. A spot intensity is considered an outlier if it has a value of 1.5 times the interquartile range (distance between top and bottom of the box) away from the top or bottom of the box.