
Figure 3.
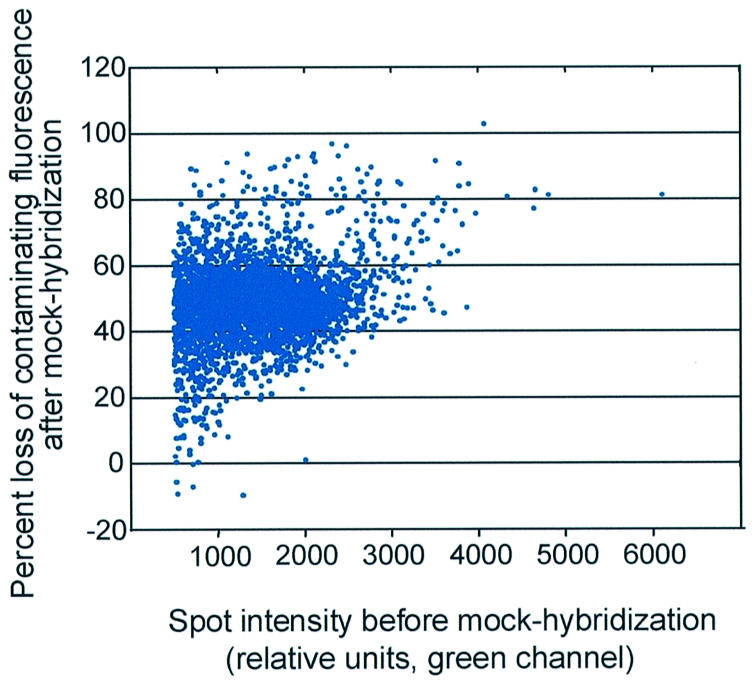
Contaminating fluorescence after hybridization cannot be accurately predicted by pre-hybridization scans. Spots from a commercial microarray slide (CMT12015426, lot 28300001, Corning) were quantified before and after mock-hybridization. Spot intensity was calculated as (median pixel intensity – median background pixel intensity) for the green channel (532 nm). Percent loss of contaminating fluorescence was calculated as [1 – (spot intensity after treatment/spot intensity before treatment)] × 100%. The spot intensity before treatment was graphed relative to the % loss of contaminating fluorescence. Only those spots with intensities >500 (after background subtraction), for the green channel before treatment, were included in this graph (n = 3933).