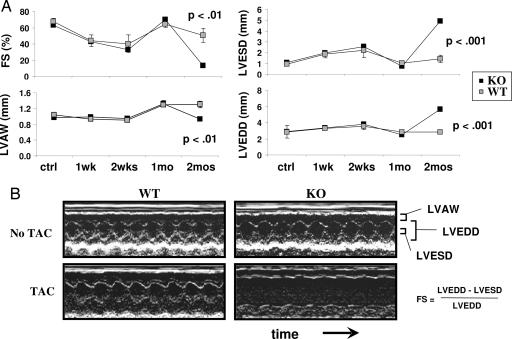
Fig. 1.
Cardiac dysfunction in response to TAC in PGC-1α−/− (KO) mice. PGC-1α WT and KO mice underwent TAC as described in Methods. (A) Average values for the indicated echocardiographic parameter from WT and KO mice during the 2 months after TAC (n = 5 in each group). Error bars indicate SEM. (B) Sample 2D echocardiographs from WT and KO mice without TAC (Upper) or 2 months after TAC (Lower).

