Fig. 4.
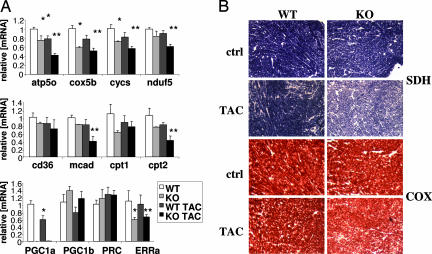
PGC-1α, genes regulated by PGC-1α, and activities of the electron transport chain, in WT and PGC-1α−/− hearts after TAC. (A) mRNA expression of representative genes of mitochondrial electron transport chain (cycs, nduf5, cox5b, and atp5o, Top), fatty acid metabolism (cd36, mcad, cpt1, and cpt2, Middle), and transcriptional regulation (PGC-1α, PGC-1β, PRC, and ERRα, Bottom) in a subset of the mice described in Fig. 1 (n = 3). ∗, P < 0.05 compared with WT. ∗∗, P < 0.05 compared with KO. (B) Views of sample frozen sections, cut transversely from the same hearts as in Fig. 2 and stained for SDH and COX activity. (Magnification: ×10.)

