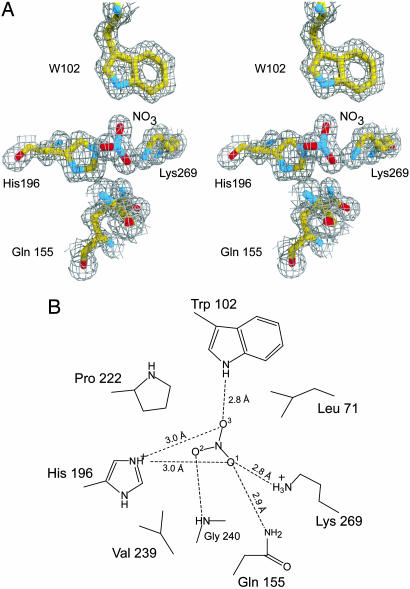
Fig. 3.
The nitrate-binding cavity. (A) Representative electron density of nitrate and coordinating residues. The map shown was calculated with the coefficients (2Fo − Fc), where Fo is the experimentally observed structure factor amplitude and Fc is the calculated structure factor amplitude from the model. For the sake of clarity, G240 was omitted. (B) Schematic representation of the nitrate-binding site. Shown here are the protein–ligand interactions between NrtA and nitrate with all potential hydrogen-bonding and electrostatic interactions depicted as dashed lines.

