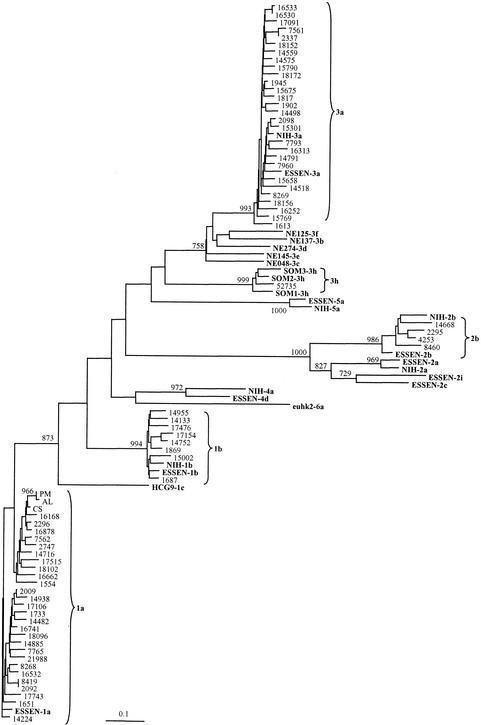
FIG. 3.
Phylogenetic analysis of the E1 region of 71 HCV samples from Danish patients compared with the C-E1 sequences from the two HCV genotyping panels from Essen and NIH, respectively, and 10 reference sequences from Fig. 2 (shown in bold). The phylogenetic tree was constructed by using the maximum-likelihood algorithm and the neighbor-joining method in the PHYLIP package (12). The numbers on the branching represent bootstrap 1000 values.

