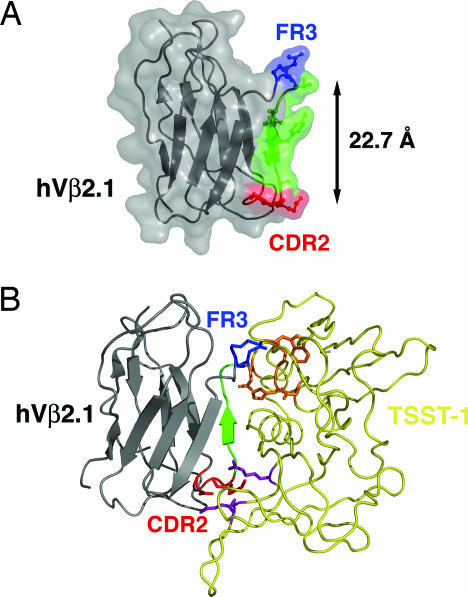
Fig. 2.
Two hot regions for TSST-1 interaction in hVβ2.1. (A) Ribbon diagram/molecular surface representation of the hVβ2.1 domain. The molecule is color-coded according to hot regions (CDR2 hot region, red; FR3 hot region, blue) and the c″ β-strand that connects the two hot regions (green). (B) Model of the hVβ2.1–TSST-1 complex. The hVβ2.1 CDR2 and FR3 hot regions are color-coded as in A; TSST-1 is yellow. The hVβ2.1 CDR2 (red) and FR3 (blue) hot regions are shown interfacing the additional TSST-1 hot region (purple) and the TSST-1 hot region originally described (orange) (32), respectively.

