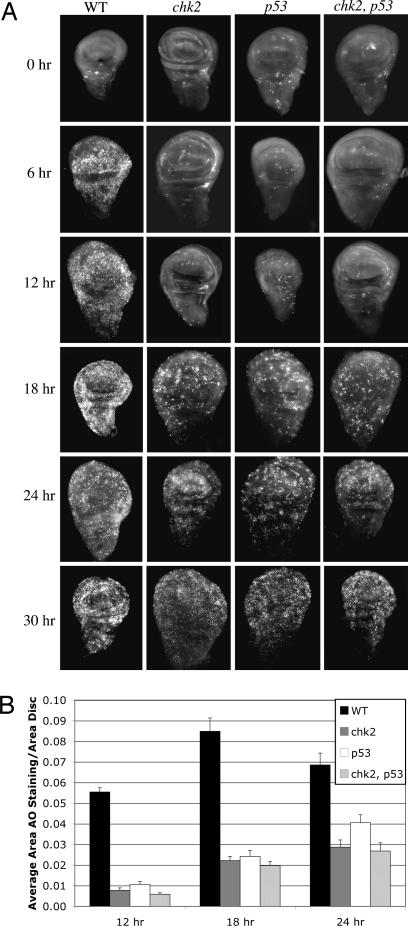
Fig. 1.
Time course of cell death in chk2 and p53 single and chk2, p53 double mutants. (A) Ninety-six- to 120-hr-old third-instar larvae were irradiated with 4,000 R of x-rays. Imaginal discs were dissected at various times after irradiation and stained with AO to detect dead cells. Only wing imaginal discs are shown. Genotypes are indicated for WT, mnkp6 (chk2), and p535A-1-4 (p53) mutants and mnkp6, p535A-1-4 (chk2, p53) double mutants. (B) The fractional area of each disk stained with AO was quantified for 12-, 18-, and 24-hr time points. Error bars represent SEM. The data are from 10 to 21 discs per genotype per time point.

