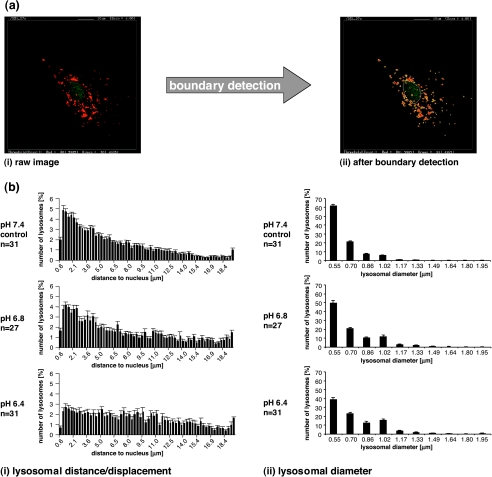
Figure 3.
(a) Snapshots displaying the image analysis window of our in-house software to demonstrate the boundary detection of the nucleus (white line) and the lysosomes (yellow lines) performed by the software. The image on the left is a (i) raw fluorescence image of a single MDA-MB-231 cell (80 x 80 m) and the image on the right shows (ii) the same image after boundary detection by the software. (b) The frequency distribution of (i) lysosome-to-nucleus distance and (ii) lysosomal diameter in MDA-MB-231 breast cancer cells exposed to pH 7.4 (upper panel, control), pH 6.8 (central panel), or pH 6.4 (lower panel). Individual cells (typically from one to two cells per image) from four independent stainings per pH value were analyzed.

