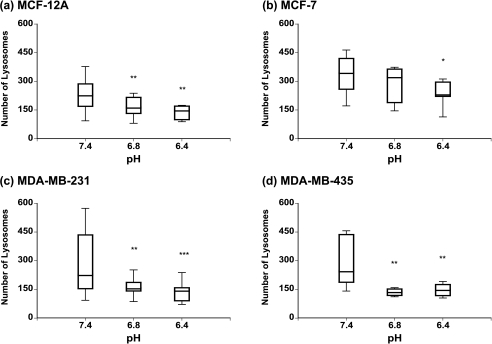
Figure 6.
Box-and-whisker plots of changes in lysosomal number with extracellular pH in (a) MCF-12A, (b) MCF-7, (c) MDA-MB-231, and (d) MDA-MB-435 cells. The box represents the range between the third quartile and the first quartile of the respective distribution displaying the length of the interquartile range, which is 50% of the data. The median of the distribution is indicated by the horizontal line in the box. *Represents P < .05. **Represents P < .01. ***Represents P < .001, pH 6.8 vs 7.4 and pH 6.4 vs 7.4 (Mann-Whitney U-test; if D ≠ 0, P values for D > 0, D < 0).

