Abstract
The molecular mechanisms involved in tumor progression from a low-grade astrocytoma to the most malignant glioblastoma multiforme (GBM) have been hampered due to lack of suitable experimental models. We have established a model of tumor progression comprising of two cell lines derived from the same astrocytoma tumor with a set of features corresponding to low-grade glioma (as in HNGC-1) and high-grade GBM (as in HNGC-2). The HNGC-1 cell line is slowgrowing, contact-inhibited, nontumorigenic, and noninvasive, whereas HNGC-2 is a rapidly proliferating, anchorage-independent, highly tumorigenic, and invasive cell line. The proliferation of cell lines is independent of the addition of exogenous growth factors. Interestingly, the HNGC-2 cell line displays a near-haploid karyotype except for a disomy of chromosome 2. The two cell lines express the neuronal precursor and progenitor markers vimentin, nestin, MAP-2, and NFP160, as well as glial differentiation protein S100β. The HNGC-1 cell line also expresses markers of mature neurons like Tuj1 and GFAP, an astrocytic differentiation marker, hence contributing toward a more morphologically differentiated phenotype with a propensity for neural differentiation in vitro. Additionally, overexpression of epidermal growth factor receptor and c-erbB2, and loss of fibronectin were observed only in the HNGC-2 cell line, implicating the significance of these pathways in tumor progression. This in vitro model system assumes importance in unraveling the cellular and molecular mechanisms in differentiation, transformation, and gliomagenesis.
Keywords: Glioblastoma, tumorigenicity, invasion, c-erbB2, neuroglial
Introduction
Gliomas are the most common of primary brain tumors and account for more than 40% of all central nervous system (CNS) neoplasms. The tumors are thought to arise by the transformation of an intraparenchymal glial cell that eventually invades surrounding tissues and develops as a result of stepwise accumulation of multiple genetic alterations [1,2]. An understanding of the mechanism(s) of tumor progression from grade 1 anaplastic astrocytoma (AA) to grade 4 glioblastoma multiforme (GBM) using a series of experimental approaches would be of importance in limiting the advancement of the disease and in prolonging survival. Models used to understand the sequential events leading to malignancy are the implantation of malignant cells into animal brain tissues and the creation of a situation similar to tumor growth in vivo. However, the complexity of such animal models makes it difficult to identify the individual processes involved in sustained tumor growth, angiogenesis, and invasion [3]. Other strategies involve using primary cultures of normal human astrocytes transfected with specific gene constructs for studying tumor progression. Such studies have highlighted the role of p53, p16/pRB pathway, Ras, and telomerase in AA [4–6]. Activation of Akt pathway [7], epidermal growth factor receptor (EGFR) overexpression [5], and upregulation of VEGF [8] individually or in combination may also be essential to convert AA to GBM. However, these strategies, besides depending on the success of establishment of individual primary astrocyte cultures, would allow the investigator to study only specific pathways triggered by the gene construct, whereas in most tumors, multiple oncogenic events cumulatively are required to predispose the cells toward a completely transformed phenotype. The availability of different cell lines representing different grades from AA to GBM transformation independently and yet sequentially may form a good model for tumor progression and help in delineating the exact steps in neoplastic transformation.
Cell lines developed from human CNS tumors are difficult to establish in long-term cultures and frequently demonstrate dwindled growth after 10 to 15 passages and reach crisis. The success rate for establishment of long-term cultures [9] is as low as 5%, whereas for short-term cultures, it is only about 41% [10], thus limiting the usefulness of cell cultures as experimental models. The molecular events leading to glial neoplasms may result from dedifferentiation of mature cells or blockage of differentiation in adult glial progenitors [11]. However, the lack of information about lineages involved in tissue development and the specific precursor cell population representing normal counterparts of human tumors and problems encountered in growing CNS tumors in culture often makes it difficult to delineate the differences between normal and tumor cells and to understand the steps involved in gliomagenesis. One of the major issues addressed regarding the origin of gliomas and other brain tumors is whether these tumors arise from stem cells or are derived from adult-differentiated cells, which undergo dedifferentiation and begin to recapitulate development for some reasons [12]. Recently, Ignatova et al. [13] have reported the existence of stem-like cells in cortical glial tumors grown in the presence of pleiotropic factors, which are capable of developing into clones that are heterogeneous in the expression of neural lineage-specific proteins. So far, very few immortalized cells with neural stem cell-like features have been reported. Among the few well-characterized cell lines is the mouse hypothalamic cell line (VI) derived from embryonic day 14 cells generated using retroviral SV40 constructs expressing most neuronal and glial markers such as NFPs, GFAP, and S-100 [14]. Another cell line, the mes-c-myc cell line (A1), generated by retroviral infection of cultured embryonic mesencephalic cells [15], was shown to coexpress both neuronal and glial markers. However, there are no immortalized human cell lines that display both glial and neural precursor markers.
Here, we report the establishment of a novelmodel system generated from human malignant glioma comprising two cell lines—human neural glial cell lines HNGC-1 and HNGC-2—which express neural stem cell-like characters. Interestingly, the HNGC-2 cell line has maintained a stable population of cells with a near-haploid karyotype for a number of population doublings in culture. To the best of our knowledge, this model system comprising of two cell lines with features representing two sequential stages—grade 1 astrocytoma and grade 4 glioblastoma in gliomagenesis—forms an excellent model system for studying the mechanisms related to transformation and in furthering knowledge in unraveling the signal transduction pathways in gliomagenesis.
Materials and Methods
Patients
A neuroepithelial tumor diagnosed as glioma was surgically resected from the frontal lobe of a 66-year-old male at the Department of Surgery, Government General Hospital (Pune, India). The tumor tissue was collected in culture medium after surgery and processed immediately. Informed consent was sought from the patient. The study was approved by the Bio-Ethics Committee of NCCS (Pune, India).
Cell Culture
The tumor tissue was washed in Dulbecco's modified Eagle's medium (DMEM) with 10 x concentration of penicillin (200 U/ml) and streptomycin (100 U/ml). After three washes of 10 minutes each with 5 x and 1 x concentrations of penicillin and streptomycin, the tissue was finely dissected into 2- to 4-mm tissue fragments. Explant and adherent cultures were set up with these tissue fragments. For explant cultures, 10 to 12 explants were seeded randomly in eight 100-mm culture dishes (Falcon, San Jose, CA) and the plates were left to dry in the laminar hood for 10 to 15 minutes for the explants to adhere to plates. The explants were then incubated with 100 µl of fetal calf serum (FCS; Gibco BRL, Carlsbad, CA) at 37°C in a 5% CO2 atmosphere for 5 to 6 hours to promote better attachment of the explant to the dish. Later, the explants were fed with DMEM with 10% FCS and incubated at 37°C in 5% CO2 atmosphere and observed daily for outgrowth of cells. On the second day, cells started emerging from two to three explants from each dish. Growth from most of the explants dwindled in 4 to 5 days, but from one of the explants in the plate, cells grew vigorously and occupied the entire plate by the tenth day. The cells from this explant were detached using trypsin phosphate versine glucose (TPVG) and transferred to new culture dishes (Falcon). The cells from this primary culture could be propagated further and passaged continuously up to 25 to 30 generations without any change in cell morphology, phenotype, and growth characteristics, and were designated as HNGC-1. Around passage 28, a clone emerged from these HNGC-1 cells that was morphologically distinct, appeared refractile, displayed piling-up behavior, and was rapidly proliferating in culture. The clone was isolated from the HNGC-1 cells using cloning rings, expanded, and later cloned by limiting dilution. One clone was selected for study and expanded as a new cell line HNGC-2. Because HNGC-2 developed from HNGC-1 by spontaneous transformation of only a small subpopulation of cells, the HNGC-1 could still be propagated independently as a cell line. Both cell lines HNGC-1 and HNGC-2 were cryopreserved at regular intervals and constituted a repertoire for further study during their continuous propagation. The characterization of cell lines was done between passages 12 and 20 for HNGC-1 and passages between 120 and 130 for HNGC-2 when otherwise stated. Cell proliferation in the two cell lines was determined by 3-(4,5-dimethylthiazol-2-yl)-2,5-diphenyl-tertrazdium bromide (MTT) assay for different periods up to 96 hours [16].
DNA Content Analysis and Karyotyping
Adequate representative metaphase spreads of good quality could not be prepared from HNGC-1 due to its slow growth potential. DNA content analysis and karyotyping data were generated only with the fast-growing HNGC-2 cell line. For DNA content analysis, a 24-hour culture of 5 x 10⁵ HNGC-2 cells around p60 on fixation with ice-cold 70% ethanol was stained with 40 µg/ml propidium iodide overnight and the DNA content per cell was estimated by flow cytometer fixed with 488-nm laser FACSVantage (Becton Dickinson, San Jose, CA) [17]. Normal human lymphocytes processed similarly were used as controls for obtaining a reference diploid standard. Debris filtering was performed by gating cells on the basis of forward scatter (FSC) and side scatter (SSC). The degree of DNA content abnormalities was given according to the DNA index (DI) using peak channel values in the major peak with normal lymphocytes as reference. For practical purpose, cell populations with DI > 1.05 were considered hyperdiploid and those with DI < 0.95 were considered hypodiploid. For karyotyping, the HNGC-2 cells around passage p60 were harvested following incubation with 10 µl of 10 µg/ml colcemid (Gibco BRL) for 2 hours. Cells were then swollen with 0.075 M KCl at 37°C for 20 minutes. Cells were pelleted and fixed with 1:3 acetone:methanol fixative. GTG banding was done on 3-day-old slides using standard protocols as described [18].
Tumorigenicity Assay in Nude Mice
The HNGC-1 and HNGC-2 cultures were examined for their potential to induce tumors in 2- to 3-week-old athymic nude mice. Cells (1 x 10⁶ cells/mouse) were resuspended in 0.1 ml of phosphate-buffered saline (PBS) and injected subcutaneously into the flanks of three nude mice for each of the cell lines HNGC-1 and HNGC-2. The mice were checked periodically for tumor growth and sacrificed when the tumor volume reached about 1000mm3 or after 8 weeks, whichever was earlier. The tumor volume was calculated using the formula: Tumor Volume= 4/3π(√ major axis / 2 x minor axis / 2)3. Animal experimentation was done in accordance with the rules and regulations of the animal ethics committee of the NCCS.
Matrigel Invasion Assay
The Matrigel invasion chambers were used to assess the metastatic potential of the cell lines HNGC-1 and HNGC-1 under in vitro conditions. The invasion assay was set up in BD Bio-Coat Matrigel Invasion Chambers with Falcon Cell Culture Test Inserts (Becton Dickinson) containing an 8-mm pore size poly(ethylene terephthalate) (PET) membrane with a thin layer of Matrigel basement membrane matrix essentially following the manufacturer's instructions. For invasion assay, control inserts and test inserts were rehydrated for 2 hours in humidified tissue culture medium at 37°C in 5%CO2 atmosphere and placed in wells of 24-well plates. The HNGC-1 and HNGC-2 cultures were trypsinized, washed, and resuspended in DMEM. About 5 x 10⁴ cells in 0.5 ml of complete DMEM were seeded in the upper compartment of each well of the test and control inserts for both the HNGC-1 and HNGC-2 cultures. DMEM with 5% FCS served as a chemoattractant in the lower compartments of both inserts. The plate was incubated for 22 hours in a humidified tissue culture incubator at 37°C in 5% CO2 atmosphere. After incubation, the noninvading cells on the upper surface were mechanically scrubbed and removed, and the filters were fixed and stained with Giemsa for 30 minutes and washed extensively to remove the excess stain. The invaded cells in 10 microscopic fields were counted with a 10 x objective. The assay was done in duplicate and repeated thrice. The data were expressed as percent invasion through the Matrigel matrix and membrane relative to migration through the control membrane, and were determined as the mean number of invading cells in test insert / number of cells migrating through control insert membrane x 100.
Immunofluorescence Staining and Confocal Laser Scanning Microscopy
For immunophenotyping of the HNGC-1 and HNGC-2 cell lines, the cells were grown on coverslips for 24 hours, fixed with 3.7% p-formaldehyde for 10 minutes at 4°C, washed with PBS, permeabilized with 0.1% Triton X-100, and blocked in PBS containing 1% bovine serum albumin (BSA). Mouse monoclonal antibodies antihuman nestin (Chemicon, Temecula, CA), vimentin (Sigma, St. Louis, MO), Tuj1 (Chemicon), NFP160 (Sigma), GFAP (Sigma), S100β (Sigma), and fibronectin (Chemicon), and the rabbit polyclonal antibody MAP2 antibody (Chemicon) were diluted 1:100 in PBS with 1% BSA. For the study of c-erbB2 expression, c-erbB2 monoclonal antibody (Roche, Mannheim, Germany) at a dilution of 1:100 was added directly to the fixed cell. The respective first antibodies were applied overnight at 4°C. Later, the coverslips were extensively washed in PBS with 0.5% BSA and 0.5% FCS, followed by addition of the appropriate second antibody. Secondary antibodies, anti-mouse IgG FITC and anti-rabbit IgG FITC (DAKO, Glostrup, Denmark), at a dilution of 1:40 in the same solution as the primary antibody were applied for 1 hour at room temperature. As a control for immunocytochemistry (in order to exclude nonspecific background staining), isotype control was included for each immunostaining. To visualize the nuclei, the cells were then incubated with 4′,6-diamidino-2-phenylindole (DAPI) (Sigma) for 10 minutes at room temperature before being mounted with antifade 1,4-diazobicyclo-2,2,2-octanex (DABCO) in mounting medium (Sigma). The coverslips were observed using a pinhole setting of 100 mm with CFLSM (Carl Zeiss, Jena, Germany). Images were captured by the CCD-4230 camera coupled with the microscope and processed using the computer-based programmable image analyzer KS300 (Carl Zeiss).
Western Blot Analyses
The HNGC-2 culture was harvested in PBS, and 5 x 10⁵ cells were lysed in 100 µl of gel loading buffer, separated by sodium dodecyl sulfate polyacrylamide gel electrophoresis on a 10% polyacrylamide gel, and transferred onto Hybond-C-Extra membrane (Amersham, Buckinghamshire, UK). Immunodetection was performed using 1:100 dilution of c-erbB2 and EGFR antibody (Santa Cruz Biotechnology, Santa Cruz, CA) for 3 hours at 4°C. The immunoblot was incubated with anti-mouse-conjugated horseradish peroxidase secondary antibody diluted (1:1000) and developed by ECL Kit (Amersham).
Flow Cytometry Analyses
The c-erbB2 expression in HNGC-2 culture was quantified by flow cytometry. The HNGC-2 culture was grown to confluence for 24 hours and the cells were dislodged using TPVG treatment to obtain a putative single-cell suspension. Cell count was adjusted to 1 x 10⁶ cells/tube with PBS containing 0.1% BSA and fixed with 2% p-formaldehyde for 5 minutes at 4°C. The cells were washed and incubated for 1 hour at 4°C with 1:100 dilution of c-erbB2 antibody. Later, cells were washed twice in PBS containing 0.1% BSA and the pellet was incubated with 1:40 dilution of anti-mouse IgG FITC for 1 hour. After two to three washes in PBS, flow cytometric analysis was performed with FACS Vantage (Becton Dickinson) using 488-nm argon laser. Data were acquired for 10,000 cells and presented as a histogram (x = intensity of fluorescence and y = number of cells). The percent positive cells for c-erbB2 were calculated by comparison with percent positive cells in negative controls (isotype antibody), which were set at 5% positivity cutoff limit.
RNA Extraction and Reverse Transcription Polymerase Chain Reaction (RT-PCR) Analyses
The guanidine thiocyanate method was used for extraction of RNA from HNGC-1 and HNGC-2 cell lines using standard procedures [19]. The RNA was checked for its integrity on formaldehyde agarose gel and the RNA samples were DNAsed using the manufacturer's instructions. RT-PCR amplification was performed using the following gene-specific primers: Tuj1 forward: 5′-GGTGTCAGACACGGTGGTGGAAC-3′ and Tuj1 reverse 5′-CCACTCCACGAAGTAGCTGCTGTTC-3′. The RNA levels were normalized with respect to the β-actin expression using forward 5′-TCTTCCAGCCTTCCTTCC-3′ and reverse 5′-CAGGCAGCTCATAGCTCTTC-3′ primers. The products were analyzed on a 2% agarose gel.
Results
Derivation of HNGC-2 Cell Line by Spontaneous Transformation of HNGC-1
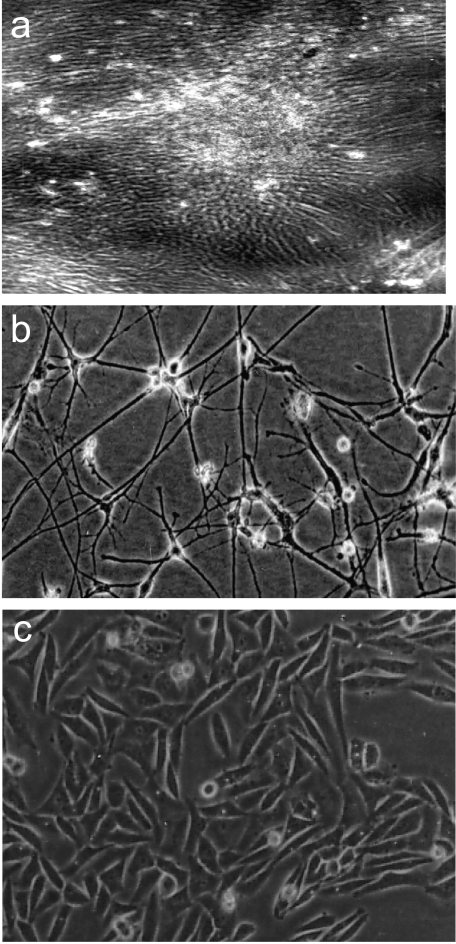
The cell line referred to as HNGC-1 in the study was derived from a neuro-epithelial tumor classified as a glioma. The cell culture was started immediately as an explant culture after its isolation from the tumor tissue. Out of the 75 to 80 explants set up in 100-mm dishes, in 4 to 5 days, a total of about six to eight explants showed emergence of small, tightly packed cells that proliferated rapidly. One of the explant tissues as shown in Figure 1a possessed a proliferating patch of cells, which in the next 7 to 8 days filled the entire Petri plate and developed into a cell line HNGC-1. During serial passaging of HNGC-1, a rapidly growing clone arose around passage 28 by spontaneous transformation that markedly differed morphologically from its parental cell line. The focus of spontaneously transformed cells on isolation and propagation was subcloned by limiting dilution. Among the eight clones obtained, one clone was chosen for the present study and propagated as an independent cell line HNGC-2. Both cell lines HNGC-1 and HNGC-2 have been in culture for the last 3 years, with HNGC-1 nearing about 50 and HNGC-2 nearing about 250 passages.
Figure 1.
Phase contrast photomicrographs depicting (a) cells emerging from explant after 5 days in vitro. The cells on serial passaging develop into an early passage cell line HNGC-1 (b). Most cells appear flat with small soma and large cytoplasmic extensions. A striking morphological change has occurred in the HNGC-2 cell line (c) on transformation, wherein cells on confluency pile up, lack cytoplasmic extensions, and display a small refractive cell body (c). Original magnification, x 10.
Morphological Features and In Vitro Growth Kinetics
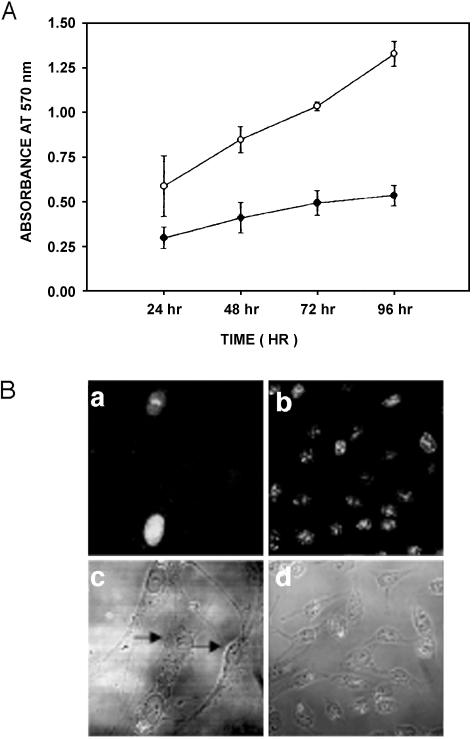
Phase contrast microscopy revealed distinct changes in cell morphology between the two cell lines HNGC-1 and HNGC-2, which remained constant at different passages during serial passaging and did not vary during the last 3 years that the cell lines were in culture. The HNGC-1 cell line showed large, flat cells that were slow-growing, contactinhibited, and displayed branched cytoplasmic cell extensions (Figure 1b). The HNGC-2 cells emerged initially as a small island of rapidly growing cells in a background of large, flat cells of HNGC-1 and were characterized by smaller, refractile, fast-growing, dense patches of cells that were noncontact-inhibited and displayed a tendency for piling up and foci formation (Figure 1c). Whether the morphological differences seen in culture transcended to their growth potential was assayed using MTT assay. As shown in Figure 2A, the HNGC-1 cells were slow-growing, with a population doubling time of 72 hours, compared to HNGC-2 cells, which were rapidly growing and had a doubling time of about 20 to 22 hours. Expectedly, the growth plots revealed that the mean growth rate for HNGC-1 was significantly slower than the mean growth rate for HNGC-2. Because both cell lines were cultured under identical growth conditions, these data indicate that the observed changes in growth rates of the two cell lines were not attributable to general incubation conditions during the experiment. Because Ki67 serves as an index of the proliferation activity of cells, the proliferation indices of the two cell lines were assessed by their Ki67 immunoreactivity. As represented in Figure 2B, although > 90% cells were expressing Ki67 in the HNGC-2 cell line, only 50% of the cells were positive in HNGC-1, suggesting that the morphological differences observed between the two cell lines are also reflected in their proliferation potential in vitro.
Figure 2.
Cell proliferation determined by MTT assay. (A) Graphical representation over a period of 96 hours in both cell lines HNGC-1 and HNGC-2. HNGC-2 is a fast-growing cell line and is in the exponential phase of growth even at 96 hours; its growth plot is represented by hollow circles. The growth of HNGC-1 cells is slow and plateaus at 48 hours; its growth plot is represented by open circles. The growth plot is representative of three similar experiments done independently at two different passages (HNGC-1, p8 and p18; and HNGC-2, p50 and p60). (B) Represents the growth potential of both cell lines assessed by their reactivity to Ki67, a proliferation marker. Only 50% of the cells stain for Ki67 in the HNGC-1 cell line (a), whereas in the case of HNGC-2 cell line, almost 80% of cells are Ki67+ (b). A corresponding phase contrast micrograph of the two cell lines is shown for HNGC-1 in (c) and for HNGC-2 in (d), respectively. The arrow heads in (c) point toward cells derived from HNGC-1 that are nonimmunoreactive to Ki67. A similar percentage of Ki67 positivity is obtained in three independent experiments.
DNA Content and Karyotype Analyses of HNGC-2 Cell line
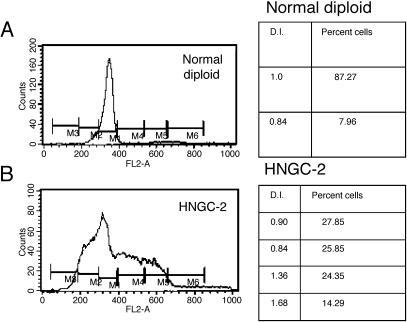
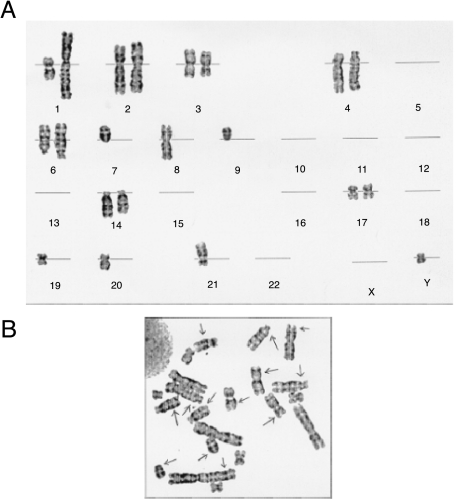
The low growth rate of HNGC-1 precluded us from preparing satisfactory chromosome spreads for its karyotype analyses as well from using it for ploidy studies. DNA content analyses of HNGC-2 assayed by flow cytometry using normal human lymphocytes as control revealed that 64.7% of the cells were haploid with DI < 0.87, and 22.28% cells were hyperdiploid with DI > 1.3 (Figure 3, a and b). Cytogenetic analysis of HNGC-2 in two different late passages revealed identical near-haploid karyotypes indicating that chromosomal changes were stably maintained in both cell lines in different passages. The haploidy was detected in almost all metaphases, as shown in Figure 4a. The most frequent karyotype observed was that of cells with 23 chromosomes with monosomies at every chromosome except chromosome 2, which was disomic. Figure 4b represents a near-haploid cell in metaphase displaying complex chromosomal rearrangements. The karyotype was stably maintained in culture as confirmed by karyotype analyses done at three different passages. Although the HNGC-1 cell line was derived from a neuro-epithelial tumor classified as a glioma, the cells appeared more neuronal-like and tempted us to speculate whether the original tumor in question was a neuroglial tumor. The cell lines were characterized for markers specific for both neuronal and glial lineages.
Figure 3.
Estimation of ploidy and DNA content of HNGC-2 by flow cytometric analyses. Normal human lymphocytes were used as reference to determine the relative fluorescence intensity for 2n population with DI = 1 (A). The distribution of HNGC-2 population with varying DNA indices with hypodiploidy and hyperdiploidy is shown in (B).
Figure 4.
Karyotype of the HNGC-2 cell line. Karyotype analysis was generated on screening of about 100 metaphases. (A) Representative karyotype showing near-haploidy and disomy of chromosome 2. (B) A nearhaploid cell of HNGC-2 in metaphase.
Stem Cell-Like Characteristics of the Cell Lines with Coexpression of Neuronal and Glial Markers
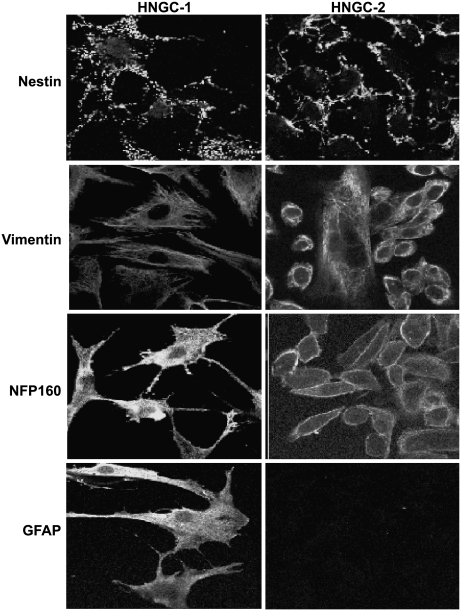
The presence of various markers important in neural lineage specification was examined in both cell lines HNGC-1 and HNGC-2. The expression and its localization were analyzed by immunocytochemistry using confocal microscopy. To characterize the cellular properties of HNGC-1 and HNGC-2, we performed immunocytochemical experiments using non-cross-reactive antibodies against neural precursor markers nestin and vimentin, glial markers GFAP and S100β, neuronal markers NSE, MAP2, and Tuj1, and neurofilaments. The cell lines HNGC-1 and HNGC 2 showed high expression of nestin (Figure 5), a neurofilament protein (NFP) that was previously shown to be one of the most specific markers of multipotent neural stem cells of the CNS, and vimentin (Figure 5), a neuroepithelial precursor marker. Immunofluorescence experiments with nestin antibody showed a distinct subcellular distribution marked with a speckled appearance of nestin-positive cells in both cell lines. Nestin is considered to be a developmental marker of neural cells that are capable of self-renewal with implications toward possible roles for nestin-positive cells in brain tumorigenesis. The high expression of nestin and vimentin independent of the malignant behavior of the cell lines argues against a recent report that nestin expression augments with increasing tumor grade. The relationship between nestin and astrocytic differentiation is complex and primary brain tumors may arise from CNS progenitor cells and nestin expression is observed irrespective of the astroglial or neuronal origin of the tumor.
Figure 5.
Immunofluorescence with antinestin, antivimentin, anti-NFP160, and GFAP in the cell lines HNGC-1 (left panel) and HNGC-2 (right panel) (x 63) grown for 48 hours in the presence of serum and visualized using anti-mouse IgG FITC. All photographs are taken at the same settings of pinhole and detector gain of 100 µm.
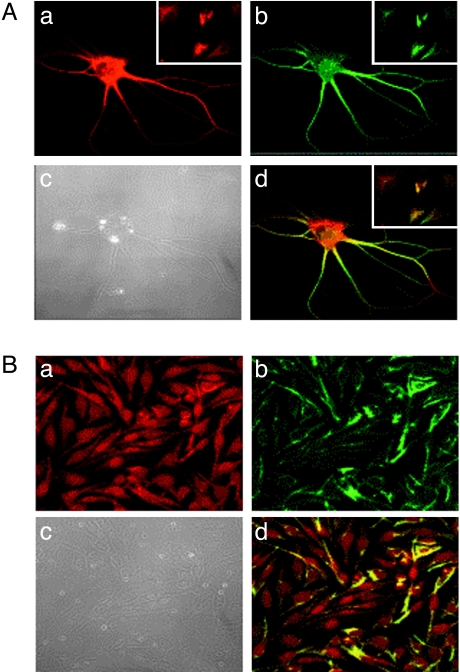
All cells in the two cell lines were weakly positive for lowmolecular-weight and high molecular weight NFPs NFP-68 and NFP-200, but they were all strongly positive for unphosphorylated medium-molecular-weight protein NFP-160 (Figure 5). Glial marker GFAP was positive in most cells in only the HNGC-1 cell line with homogeneous staining on the cell surface including cytoplasmic extensions. The expression of GFAP was totally absent in the transformed cell line HNGC-2 (Figure 5), suggesting an association between the loss of expression of GFAP with decreasing differentiation and increasing malignancy. Interestingly, HNGC-1 was intensely positive for an astroglial marker S100β (green) and MAP-2 (red), a protein linked to the neuronal cytoskeleton in the mature CNS, as shown in Figure 4, a and b, respectively. The expression of both glial and neuronal proteins in the cell line encouraged us to find out whether the same cells coexpressed S100β and MAP-2. Our colocalization studies revealed expression of both molecules to a single cell (yellow) (Figure 6A,c). A representative picture with more number of cells in the insert at a lower magnification of x 40 clearly shows that all cells colocalize the neuronal and glial marker. The high S100β expression was seen in the cytoplasm and the perinuclear region of cells, whereas MAP2 staining was prominent in the cytoplasm and cell processes. A similar staining pattern was observed for the transformed cell line HNGC-2 (Figure 6B) with individual expression of S100β marked by green fluorescence (Figure 6B,a), MAP-2 marked by red fluorescence (Figure 6B,b), and their colocalization to a single individual cell resulting in yellow fluorescence (Figure 6B,c). The corresponding phase contrast images of both cell lines HNGC-1 and HNGC-2 are shown in Figure 6, A,d and B,d, respectively, and indicate the fact that each cell in the population coexpresses the neuronal and glial markers in both cell types.
Figure 6.
Double immunofluorescence labeling of cells. (A) HNGC-1's and (B) HNGC-2's double immunofluorescence labeled with MAP-2 and S100β antibodies coexpress neuronal and glial markers and are visualized using fluoresceinated rhodamine-conjugated anti-rabbit IgG and anti-mouse IgG FITC. Cells independently immunoreactive for MAP-2 stain red (a) and those immunoreactive for S100 stain green (b) whereas colocalization of both molecules MAP-2 and S100 to the single cell resulted in yellow color, as shown in overlay images (d). Note that all cells are dual positive in case of HNGC-1 (shown in insert—d) as well as in HNGC-2 (d). Original magnification, x 63. A phase contrast micrograph of cells of HNGC-1 and HNGC-2 is shown in (c).
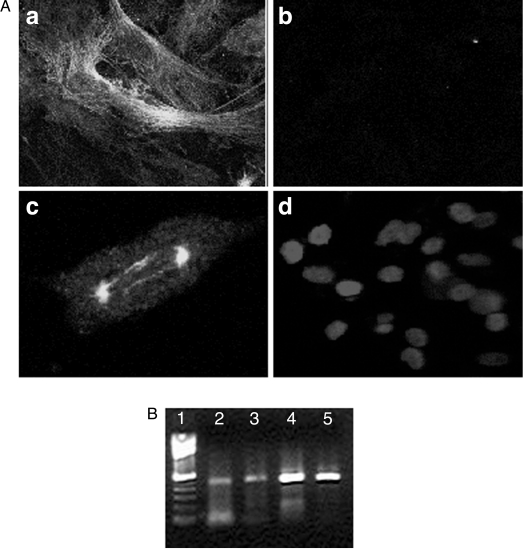
The expression of Tuj1, an early neuronal marker, as examined by immunostaining was seen in a small percentage of cells of the HNGC-1 cell line (Figure 7A,a). An image of Tuj1 positivity in a single representative cell of HNGC-1 cell line is shown in Figure 7A,c. The staining was remarkably detected only in the spindle of mitotic cells and in the midbody of cells joined at cytokinesis, indicating that neuronspecific tubulin expression was initiated during or before the final mitosis of neural progenitors. There was a significant decrease in immunoreactivity with Tuj1 in HNGC-2, as seen in Figure 7A,b. The corresponding image of HNGC-2 cells stained with DAPI is illustrated in Figure 7A,d. Although Tuj1 immunostaining indicates expression only in HNGC1, analyses with Tuj1-specific primers in RT-PCR gave a different picture. Both cell cultures demonstrated similar expressions of Tuj1, as shown in Figure 7B.
Figure 7.
Expression of Tuj1 in HNGC-1 and HNGC-2 cell lines. (A) Immunoreactivity to Tuj1 was observed only in HNGC-1 as intense filamentous staining (a) in a small population of cells. A single cell from HNGC-1 displaying the characteristic expression in the mitotic spindle is shown in (c). There was no immunodetectable expression of Tuj1 in the HNGC-2 cell line. (b) The nucleolus of the same cells stained with DAPI is represented in (d). Original magnification, x 63. (B) Expression of Tuj1 was analyzed at the RNA level by RT-PCR using Tuj1-specific primers. The RT-PCR products were analyzed on 1% agarose gel stained with ethidium bromide. Lane 1 corresponds to the molecular weight marker 1 kb. Lanes 2 and 3 show expression of the 540-bp Tuj1 in both cell lines HNGC-1 and HNGC-2. Lanes 4 and 5 represent β-actin PCR used as RNA loading control for the HNGC-1 and HNGC-2 cell lines, respectively. The RT-PCR products were confirmed by sequencing of the cDNA products.
The more differentiated HNGC-1 and the less differentiated HNGC-2 failed to express structural markers NSE and Tau characteristic of mature differentiated neurons, and the oligodendrocyte myelinating antigen specific for cells of the oligodendrocyte lineage (data not shown). The characterization studies indicate that both cell lines express both neuronal and glial markers in a single cell and may possibly harbor a stem and neural progenitor population in CNS tumors.
The HNGC-2 Cell Line Is Highly Tumorigenic and Invasive Compared to the Known Established Glioma Cell Lines
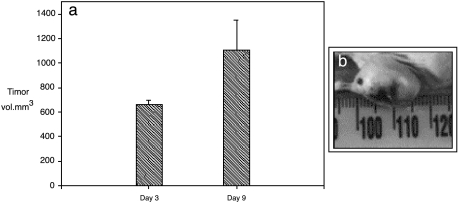
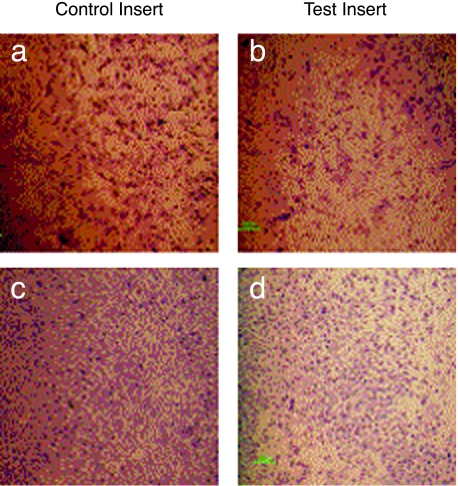
The HNGC-2 cell line was derived from HNGC-1 by spontaneous transformation. The HNGC-2 cells were refractile and proliferated rapidly and, in contrast to HNGC-1, exhibited all in vitro correlates of transformation like growth in low serum and clonogenicity in soft agar, with mean ± SD being 650 ± 68.6 colonies in 10 days (data not shown). The in vitro correlates of the transforming potential of the cell lines were strongly matched by their in vivo attribute of tumor formation in nude mice. No palpable tumors developed in the HNGC-1 cell line for a period of up to 8 weeks that the mice were kept under observation. In contrast, in the HNGC-2 cell line, tumors developed at the site of injection in all the injected mice within 3 to 4 days and reached a tumor volume of 1103 ± 246 mm3 in 9 days (Figure 8a). The high tumor load on the mouse compelled us to sacrifice the mouse on the 10th day itself. A representative of the tumor in situ is depicted in Figure 8b. Paralleled with high tumorigenicity, HNGC-2 cells were also characterized by a higher invasion capacity as assayed by Matrigel penetration assay. The ability of cells to migrate through Matrigel is enhanced in metastatic cells and the degradation of the basement membrane is a critical step in tumor invasion. The HNGC-1 and HNGC-2 cell lines were assayed for their invasiveness by determining the percentage of cells that can invade the control insert and test insert. As shown in Figure 9, a and b, in the HNGC-1 cell line, only 8% to 10% cells migrated through the test insert compared to the control insert. In contrast, in the HNGC-2 cell line, about 80% cells migrated through the test insert compared to the control insert (Figure 9, c and d). The capacity of the HNGC-2 cell line to form vigorous tumors in a short time of 8 to 9 days and its high invasiveness have not yet been reported to date for any of the known and widely used glioma cell lines.
Figure 8.
In vivo tumorigenicity assay. (a) The nude mice injected with only the HNGC-2 cell line developed tumors rapidly, as shown in the histogram. The tumor in situ at day 9 is shown in (b). The tumorigenicity data are represented as tumor volume ± SD of three independent experiments performed in replicates with groups of three mice each.
Figure 9.
Matrigel invasion assay. For the HNGC-1 (a,b) and HNGC-2 (c,d) cell lines, cells penetrating through the control insert are shown in (a & c) and those penetrating through the test insert are shown in (b & d). The data are representative of one of five independent experiments.
Loss of Fibronectin Expression with Decrease in Astrocytic Differentiation in the Two Cell Lines
Fibronectin is an important extracellular matrix (ECM) protein involved in cell-microenvironment interaction. Its loss is frequently associated with increased invasiveness. The availability of a model system with cell lines of the same origin and yet varying drastically in their growth potential would be important in correlating the existence of fibronectin with invasion. The changes in fibronectin expression in cells at different passage levels were analyzed by indirect immunofluorescence assay using antibodies to cytoplasmic fibronectin. Figure 10a represents HNGC-1 passage 8 cells highly expressing fibronectin as an intense filamentous network. The same cell line at later passages like at p25 demonstrated a gradual decrease in intensity of fibronectin staining (Figure 10b).There was a total loss in expression of fibronectin in the HNGC-2 cell line, which developed on spontaneous transformation around p28. The same pattern of the loss of fibronectin expression was reproduced on revival of cryopreserved cells at these passages. Similar results were obtained with secretory fibronectin also as confirmed by dot blot analyses (data not shown).
Figure 10.
Progressive loss of fibronectin immunoreactivity on malignant transformation of HNGC-1 cell line. (a) Intense expression of fibronectin in HNGC-1 cells at p18, (b) with a subsequent diminution in intensity at p28 in the HNGC-1 cell line (c) and a total loss of expression in the HNGC-2 cell line. Inset in (c) shows a phase contrast micrograph of HNGC-2 cells. All photographs were taken at the same settings of pinhole and detector gain. Original magnification, x 63. Similar results were obtained on cells revived after cryopreservation at the mentioned passages or even in passages close to the ones mentioned above.
EGFR and c-erbB2 Overexpression May Be One of the Pathways Responsible for Transformation in HNGC-2
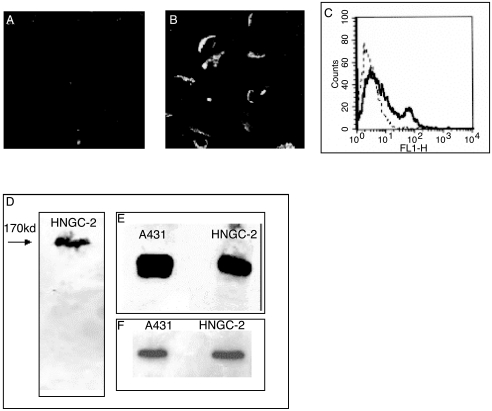
EGFR and the mutant form of EGFR, c-erbB2, are frequently overexpressed in gliomas and other tumors. Immunostaining with c-erbB2 antibody demonstrated typical membranous staining in 30% to 40% of the HNGC2 cells and almost no expression in the HNGC-1 cell line, as studied by confocal microscopy (Figure 11, a and b). Forty percent of cells from the HNGC-2 cell line that were positive for c-erbB2 expression also showed a high mean fluorescence intensity (MFI), indicating overexpression of c-erbB2 receptors (Figure 11c). A 170-kDa EGFR protein band was evident in the HNGC-2 cell line on Western blotting (Figure 11d). The expression of c-erbB2 of HNGC-2 at the protein level (Figure 11e) was higher than its EGFR expression as observed from β-actin loading controls (Figure 11f).
Figure 11.
Expression of c-erbB2 and EGFR. The HNGC-1 cell line was not immunopositive for c-erbB2, as assayed by immunostaining with c-erbB2 antibody (A). About 30% to 40% of the cells from the HNGC-2 cell line showed a strong membranous staining for c-erbB2 (B) and this was quantitatively assayed by flow cytometry wherein, as demonstrated in a representative experiment, a distinct peak of erbB2+ cells is observed with a percent positivity of 35% and an MFI of 38 above a negative cutoff with isotype control of 5% (C). HNGC-2 expressed a 170-kDa EGFR band in Western blotting (D). The expression of c-erbB2 as a 185-kDa protein (E) in the HNGC-2 cell line was comparable to that of the A431 cell line used as a positive control. Equal loading of protein was confirmed by using β-actin loading controls for the two cell lines A431(f) and HNGC-2.
Discussion
We report here the establishment of two novel human cell lines, designated as HNGC-1 and HNGC-2, derived from a single astrocytoma tumor. The HNGC-1 cell line represents a very slow-growing cell line that was contact-inhibited and did not under go senescence in vitro, suggesting that cells emerged from the first crisis in the tumor itself. The cell line could be cultured continuously, was nontumorigenic, and represented a premalignant cell line. During serial passaging of the HNGC-1 cell line, few of the cells overcame the second proliferative block referred to as crisis and a spontaneously transformed clone emerged around passage 28. The cell line established from this clone is referred to as HNGC-2. The two cell lines HNGC-1 and HNGC-2 differ strikingly in their morphological appearance, growth characteristics, tumorigenic potential, as well as invasiveness, and represent a stable transition in vitro from low-grade astrocytoma (as in HNGC-1) to high-grade GBM (as in HNGC-2).
The HNGC-2 cell line on cytogenetic analysis demonstrated an unusual karyotype with near-haploidy and various structural complex chromosomal translocations. Peculiarly, this clonogenic cell line remained karyotypically stable over all passages in culture, allowing for the continuous maintenance of near-haploid cells in culture. There are very few reports about a stable haploid cell line developed from a solid tumor although an unusually high percentage of epitheloid tumors as well as all cases that do show hypodiploidy correlate with adverse prognosis [20,21]. Haploidization may possibly be the result of an abnormal karyokinesis induced in the tumor [22], or due to the multiple genetic alterations occurring during malignant transformation in culture. The cause of near-haploidy seen in HNGC-2 is not yet discernable and needs to be further investigated.
A detailed analysis of molecular markers comprising neuroepithelial stem and precursor cell markers nestin and vimentin; early and late neuronal differentiation markers NFPs, MAP-2, Tuj1; and glial markers S-100β and GFAP revealed that both cell lines express markers important in neural lineage specification and differentiation. Serially passaged cells were uniformly immunoreactive for lineage-independent early neuroepithelial markers nestin [23] and vimentin [24]. In few adult neurons and in glial progenitor cells, vimentin is present along with nestin, and vimentin along with GFAP are present in mature astrocytes [24]. Although vimentin, the major cytoskeletal component present in immature glia [25], is expressed to the same extent in all grades of astrocytic tumors, the intensity of nestin immunostaining correlates with the malignancy grade in gliomas [22,26,27]. The expression of nestin, an intermediate filament protein used to describe stem and progenitor cells, is reported during the transition from a progenitor stage to glial differentiation in the mammalian CNS, suggesting a differential temporal regulation of nestin expression during glial and neuronal cell differentiation [28]. Contrary to these reports, in our model system, it is intriguing that the slow-growing, more differentiated HNGC- 1 and highly tumorigenic and invasive HNGC-2 showed similar high expression of nestin, thereby suggesting a lack of association between nestin and malignancy. Although expression of vimentin has been reported in most of the glioma cell lines U-118MG, U-373MG, Hs683, and U- 87MG, nestin has been reported only in the U-373MG glioma cell line as a diffused cytoplasmic fluorescence [27]. An association between nestin expression and ascending malignancy has been documented in clinical samples but does not seem to exist in cell lines. Surprisingly, nestin was not detected in U-87MG and Hs683 cell lines, both derived from malignant glioma, suggesting that nestin expression may not directly correlate with malignancy in cell lines and argues toward the possibility of a stem/ precursor cell population in the tumor of origin.
GFAP, a protein marker important in astrocytic differentiation, is expressed in astrocytoma cell lines [29]. Our findings of expression of GFAP in the more differentiated HNGC-1 and its loss in the transformed HNGC-2 reflect the in situ clinical picture in the tumors supporting the speculation that loss of GFAP expression may reflect tumor progression toward a more rapidly growing and malignant phenotype [30]. Also, the changes in GFAP and nestin gene expression correlate with changes in shape and motility as seen with U373 cells, and indicate that these cells have progressed toward a less differentiated state [31]. The loss of GFAP in HNGC-2 is possibly responsible in driving it toward a highly transformed state and further exemplifies the usefulness of our model system in tumor progression.
The positivity of markers vimentin, nestin, GFAP, and S100β pointed towards astrocytic lineage of the cell lines. Because one of the goals of our study was to determine the contribution of individual cytoskeletal elements during differentiation and malignant transformation, we attempted to characterize the cell lines for expression of neuronal markers MAP-2, Tuj-1, and NFPs, and also study the coexpression of neuronal marker (MAP-2) with an astrocytic marker (S100β) to the same cell due to the heterogeneity in gliomas.
MAP2, a neuronal marker, has been recently identified in glial precursor cells, indicating its potential role in glial development [32]. Although expression of high-molecular-weight MAP-2 has been reported in high-grade astrocytomas and oligodendroglial neoplasms [33], its presence in the glial cell lines is not reported. Coexpression of S100β and MAP-2 was seen in all cells derived from both cell lines HNGC-1 and HNGC-2, indicating the existence of a neural precursor population that can undergo morphological and functional differentiation into neuronal and glial lineage without losing its precursor properties [15]. The aberrant expression of both neuronal and glial markers to the same cell type has been reported in reactive mouse astrocytes treated with EGF wherein coexpression of neuronal markers like GABA, Tau, and Map-2 with glial markers GFAP and nestin was observed, suggesting that these cells may have arisen either in response to CNS trauma, or may have been derived from neural progenitor cells rather than from previously differentiated astrocytes [34]. Another explanation could be that although the expression of IF proteins is tissue-specific and developmentally regulated, and is a good marker for determining the cell origin and differentiation status of tumor cells, like GFAP expressed only in astrocytomas and NFPs only in tumors of neuronal origin, the tumor cells themselves may express IF patterns, which are irrelevant to the cell origin and differentiation status of tumors [35].
The neuronal commitment marker, Tuj1, important in the development and differentiation of CNS [36], was positive in HNGC-1 and HNGC-2 at the RNA level. Although Tuj1 expression has been observed to the same extent at the RNA level in both cell lines, it is detectable at the protein level only in HNGC-1, suggesting that changes in mRNA levels often precede and are more pronounced than changes in protein levels. NFP, another marker for neuronal commitment, was intensely expressed in almost all cells in both cell lines, furthering our conjecture of a neuronal phenotype in the cell lines under study. Although the expression of neuronal markers nestin MAP-2, Tuj1, and NFP-160 in tumor specimens from astrocytomas/gliomas is associated with high-grade malignancy, there are no cell line(s) derived from astroglial tumors that express MAP2, Tuj1, and NFP-160 proteins. Although there are reports on the coexpression of nestin, vimentin, and GFAP in the U-373MG glioma cell line and another report on the coexpression of GFAP, vimentin, and cytokeratins in the GL-15 glioblastoma cell line, there are no cell lines reported that coexpress neuroepithelial stem and progenitor markers as well as mature neural markers. To the authors' knowledge, this is the first report on human glioma/neuroglial cell lines possessing the unique feature of coexpression of neuronal markers such as nestin, vimentin, MAP-2, and NFP160, and glial markers S-100β and GFAP. Except GFAP, as these markers are expressed in both cell lines to the same extent and have no relation to the tumorigenicity of the cell lines, it is tempting to speculate the possibility of existence of stem cell/precursor cell population in the derived cell line with a tendency toward neuronal differentiation.
The HNGC-2 cell line is highly tumorigenic and invasive, and its tumor-forming potential is remarkably high compared to the available established glioma cell lines. Most glioma cell lines A172, H4, Hs683, U-138MG, and U-118MG are nontumorigenic, although some of these cell lines are known to form colonies in soft agar. Even the glioma cell lines U-87MG, LN18, and LN229 derived from aggressive and malignant tumors require very high cell number (107) and longer periods up to 2 to 3 months to produce an appreciable size of tumors in nude/SCID mice. T98G cells derived from a grade 4 human glioblastoma multiform tumor does not grow when implanted subcutaneously or intracerebrally in nude mice and forms tumors only when suspended in reconstituted basement membrane Matrigel [37]. In a striking contrast, the HNGC-2 cell line produced large tumors (> 1000 mm3) within 6 days of injection with only 106 cells when suspended in PBS. Our study with the cell lines found significant correlation between Ki67 expression and growth kinetics in vitro and in vivo tumor growth, suggesting that in vitro changes are related to malignant progression in vivo [38].
Matrigel penetration assays were used to compare invasive activities in HNGC-1 and HNGC-2 cell lines. The HNGC-1 cell line showed low invasion activity (12%), whereas the HNGC-2 cell line demonstrated a five-fold greater invasion potential (60%), which is significantly higher than published values (40%) of the HT 1080 fibrosarcoma cell line [39]. Glioma being an aggressive and invasive tumor, the availability of a highly invasive cell line will be appropriate for transformation studies. In the present study, we found a progressive loss in fibronectin expression during the evolution of HNGC-2 from HNGC-1. This reaffirms the usefulness of this model system in understanding tumor progression as sequential fibronectin loss would contribute toward a more rapidly growing and malignant phenotype in HNGC-2.
The high tumorigenicity and transforming potential of HNGC-2 could also be due to the overexpression of EGFR and c-erbB-2 oncoproteins. Studies with different grades of astrocytomas and gliomas revealed no expression of the EGFR and c-erbB-2 protein in low-grade astrocytomas (G1, G2) but a remarkable increase in anaplastic and malignant gliomas [40]. The results emphasized that EGFR and c-erbB-2 proteins were expressed in astrocytic tumors with increased malignancy and dedifferentiation.
Frequent genetic alterations in aggressive grade 4 glioma result in stimulation of common signal transduction pathways involving oncogenes [41]. According to a recent report, EGFR gene amplification demonstrated in GBM cells in vivo is lost when cells are cultured in vitro during multiple passages [42]. Interestingly, high levels of EGFR and c-erbB2 were expressed in the HNGC-2 cell line, whereas no detectable levels were seen in the HNGC-1 line. However, the high expression in the HNGC-2 and not in the HNGC-1 cell line suggests that its expression might be related to malignant phenotypes of the HNGC-2 on transformation. Although overexpression of EGFR has been associated with GBM, there are no appropriate cell lines for understanding EGF signaling with the only exception of SKMG-3 [43]. Based on these reports and our findings, we propose that these two cell lines would be a good model to study mechanisms in EGF signaling and tumor progression in gliomas.
The pathways in gliomagenesis that lead to malignancy are multiple and complex, and involve abnormalities in the cell cycle proteins, p16-cdk4-pRb, cell cycle arrest pathways involving ARF-MDM2-p53, and deregulation of lipid phosphatase PTEN, which regulate cellular responses to receptor tyrosine kinases [6,44]. The precise molecular event(s) triggered when overcoming the crisis resulting in neoplastic transformation and progression in our HNGC-2 cell line remains unknown. A number of issues that could be addressed using the two cell lines would be: analysis of the significance of cytoskeletal elements in neural tumors, understanding the implications of the coexpression of intermediate filament proteins in malignancy, and, ultimately, deciphering the signaling pathway in tumor progression. In conclusion, the in vitro model system developed by us would be valuable to understanding the contribution of several genes associated with tumorigenesis, to unraveling the steps in anaplastic progression in gliomas, and to providing better therapeutic strategies for patients with malignant CNS tumors.
Acknowledgements
We thank Anjali Patekar for her skilled technical support and Ashwini Atre for extending her expertise in confocal microscopy.
Abbreviations
- GFAP
glial fibrillary acidic protein
- NFP
neurofilament protein
- GBM
glioblastoma multiforme
- Tuj1
βIII tubulin
- CFLSM
confocal laser scanning microscopy
- MAP-2
microtubule-associated protein
Footnotes
The authors acknowledge the Indian Council of Medical Research (New Delhi, India) for their research grant.
These authors contributed equally to this work.
References
- 1.Kleihues P, Burger PC, Scheithaeur BW. The new WHO classification of brain tumors. Brain Pathol. 1993;3:255–269. doi: 10.1111/j.1750-3639.1993.tb00752.x. [DOI] [PubMed] [Google Scholar]
- 2.Sehgal A. Molecular changes during the genesis of human gliomas. Semin Surg Oncol. 1998;14:3–12. doi: 10.1002/(sici)1098-2388(199801/02)14:1<3::aid-ssu2>3.0.co;2-f. [DOI] [PubMed] [Google Scholar]
- 3.Engebraaten O, Hjortland GO, Hirschberg H, Fodstad O. Growth of precultured human glioma specimens in nude rat brain. J Neurosurg. 1999;90:125–133. doi: 10.3171/jns.1999.90.1.0125. [DOI] [PubMed] [Google Scholar]
- 4.Holland EC, Celestino J, Dai C, Schaefer L, Sawaya RE, Fuller GN. Combined activation of Ras and Akt in neural progenitors induces glioblastoma formation in mice. Nat Genet. 2000;25:55–57. doi: 10.1038/75596. [DOI] [PubMed] [Google Scholar]
- 5.Von Dieming A, Loius DN, Wiester OD. Molecular pathways in formation of gliomas. Glia. 1995;75:328–338. doi: 10.1002/glia.440150312. [DOI] [PubMed] [Google Scholar]
- 6.Konopka G, Bonni A. Signaling pathways regulating gliomagenesis. Curr Mol Med. 2003;3:73–84. doi: 10.2174/1566524033361609. [DOI] [PubMed] [Google Scholar]
- 7.Sonoda Y, Ozawa T, Aldape KD, Deen DF, Berger MS, Pieper RO. Akt pathway activation converts anaplastic astrocytoma to glioblastoma multiforme in a human astrocyte model of glioma. Cancer Res. 2001;61:6674–6678. [PubMed] [Google Scholar]
- 8.Sonoda Y, Kanamori M, Deen DF, Cheng SY, Berger MS, Pieper RO. Over-expression of vascular endothelial growth factor isoforms drives oxygenation and growth but not progression to glioblastoma multiforme in a human model of gliomagenesis. Cancer Res. 2003;63:1962–1968. [PubMed] [Google Scholar]
- 9.Westphal M, Meissner H. Establishing human glioma derived cell-lines. In: Mather JP, Barnes D, editors. Methods in Cell Biology. Vol. 57. USA: Academic Press; 1998. pp. 147–165. [DOI] [PubMed] [Google Scholar]
- 10.Farr-Jones MA, Parney IF, Petruk KC. Improved technique for establishing short term human brain tumor cultures. J Neuro-Oncol. 1999;43:1–10. doi: 10.1023/a:1006115608103. [DOI] [PubMed] [Google Scholar]
- 11.Liberski PP, Kordek R. Ultrastructural pathology of glial brain tumors revisited: a review. Ultrastruct Pathol. 1997;21:1–31. doi: 10.3109/01913129709023244. [DOI] [PubMed] [Google Scholar]
- 12.Linskey ME, Gilbrt MR. Glial differentiation: a review with implications for new directions in neuro-oncology. Neurosurgery. 1995;36:1–21. doi: 10.1227/00006123-199501000-00001. [DOI] [PubMed] [Google Scholar]
- 13.Ignatova TN, Kukekov VG, Laywell ED, Suslov ON, Vrionis FD, Steindler DA. Human cortical glial tumors contain neural stemlike cells expressing astroglial and neuronal markers in vitro. Glia. 2002;39:193–206. doi: 10.1002/glia.10094. [DOI] [PubMed] [Google Scholar]
- 14.Marone M, Quinones-Jenab V, Meiners S, Nowakowski RS, Geller HM. An immortalized mouse neuroepithelial cell-line with neuronal and glial phenotypes. Dev Neurosci. 1995;17:311–323. doi: 10.1159/000111301. [DOI] [PubMed] [Google Scholar]
- 15.Colucci-D'Amato GL, Tino A, Pernas-Alonso R, Ffrench-Mullen JM, di Porzio U. Neuronal and glial properties coexist in a novel mouse CNS immortalized cell line. Exp Cell Res. 1999;252:383–391. doi: 10.1006/excr.1999.4636. [DOI] [PubMed] [Google Scholar]
- 16.Hansen MB, Nielsen SE, Berg K. Re-examination and further development of a precise and rapid dye method for measuring cell growth/cell kill. J Immunol Methods. 1989;119:203–210. doi: 10.1016/0022-1759(89)90397-9. [DOI] [PubMed] [Google Scholar]
- 17.Chomczynski P, Sacchi N. Single-step method of RNA isolation by acid guanidinium thiocyanate phenol chloroform extraction. Anal Biochem. 1986;162:156–159. doi: 10.1006/abio.1987.9999. [DOI] [PubMed] [Google Scholar]
- 18.Ormerod MG, editor. Flow Cytometry A Practical Approach. 2nd ed. New York: Oxford University Press, Inc.; 1992. [Google Scholar]
- 19.Verma RS, Babu A, editors. Human Chromosomes: Manual of Basic Techniques. New York: Pergamon Press; 1989. [Google Scholar]
- 20.Toti P, Greco G, Mangiavacchi P, Bruni A, Palmeri ML, Luzi P. DNA ploidy pattern in choroidal melanoma: correlation with survival. A flow cytometry study on archival material. Br J Ophthalmol. 1998;82:1433–1437. doi: 10.1136/bjo.82.12.1433. [DOI] [PMC free article] [PubMed] [Google Scholar]
- 21.Ma SK, Chan GC, Wan TS, Lam CK, Ha SY, Lau YL, Chan LC. Near-haploid common acute lymphoblastic leukaemia of childhood with a second hyperdiploid line: a DNA ploidy and fluorescence in-situ hybridization study. Br J Haematol. 1998;103:750–755. doi: 10.1046/j.1365-2141.1998.01044.x. [DOI] [PubMed] [Google Scholar]
- 22.Kotecki M, Reddy PS, Cochran BH. Isolation and characterization of a near-haploid human cell line. Exp Cell Res. 1999;252:273–280. doi: 10.1006/excr.1999.4656. [DOI] [PubMed] [Google Scholar]
- 23.Dahlstrand J, Collins VP, Lendahl U. Expression of Class VI intermediate filament nestin in human central nervous system tumors. Cancer Res. 1992;52:5334–5341. [PubMed] [Google Scholar]
- 24.Dahl D, Rueger DC, Bignami A, Weber K, Osborn M. Vimentin, the 57,000 molecular weight protein of fibroblast filaments, is the major cytoskeletal component in immature glia. Eur J Cell Biol. 1981;24:191–196. [PubMed] [Google Scholar]
- 25.Boyne LJ, Fischer I, Shea TB. Role of vimentin in early stages of neuritogenesis in cultured hippocampal neurons. Int J Dev Neurosci. 1996;14:739–748. doi: 10.1016/s0736-5748(96)00053-6. [DOI] [PubMed] [Google Scholar]
- 26.Sugawara K, Kurihara H, Negishi M, Saito N, Nakazato Y, Sasaki T, Takeuchi T. Nestin as a marker for proliferative endothelium in gliomas. Lab Invest. 2002;3:345–351. doi: 10.1038/labinvest.3780428. [DOI] [PubMed] [Google Scholar]
- 27.Messam CA, Hou J, Major EO. Coexpression of nestin in neural and glial cells in the developing human CNS defined by a human-specific anti-nestin antibody. Exp Neurol. 2000;161:585–596. doi: 10.1006/exnr.1999.7319. [DOI] [PubMed] [Google Scholar]
- 28.Rutka JT, Murakami M, Dirks PB, Hubbard SL, Becker LE, Fukuyama S, Jung S, Tsugu A, Matsuzawa K. Role of glial filaments in cells and tumors of glial origin. J Neurosurg. 1997;87:420–430. doi: 10.3171/jns.1997.87.3.0420. [DOI] [PubMed] [Google Scholar]
- 29.Pekney M, Eliasson C, Chein CL, Kindblom GL, Liem R, Hamberger A, Betsholtz C. GFAP-deficient astrocytes are capable of stellation in vitro when cocultured with neurons and exhibit a reduced amount of intermediate filaments and an increased cell saturation density. Exp Cell Res. 1998;239:332–343. doi: 10.1006/excr.1997.3922. [DOI] [PubMed] [Google Scholar]
- 30.Rutka JT, Smith SL. Transfection of human astrocytoma cells with glial fibrillary acidic protein complementary DNA: analysis of expression, proliferation, and tumorigenicity. Cancer Res. 1993;53:3624–3631. [PubMed] [Google Scholar]
- 31.Marshak DR. S100 as a neurotrophic factor. Prog Brain Res. 1990;86:169–178. [PubMed] [Google Scholar]
- 32.Wharton SB, Chan KK, Whittle IR. Microtubule-associated protein 2,MAP-2 is expressed in low and high grade diffuse astrocytomas. J Clin Neurosci. 2002;9:165–169. doi: 10.1054/jocn.2001.1055. [DOI] [PubMed] [Google Scholar]
- 33.Schinstine M, Iacovitti L. Expression of neuronal antigens by astrocytes derived from EGF-generated neuroprogenitor cells. Exp Neurol. 1996;141:67–78. doi: 10.1006/exnr.1996.0140. [DOI] [PubMed] [Google Scholar]
- 34.Ho CL, Liem RK. Intermediate filaments in the nervous system: implications in cancer. Cancer Metastasis Rev. 1996;15:483–497. doi: 10.1007/BF00054014. [DOI] [PubMed] [Google Scholar]
- 35.Katsetos CD, Frankfurter A, Christakos S, Mancall EL, Vlachos I, Urich H. Differential localization of class III β-tubulin isotype (βIII) and calbindin-D28k defines distinct neuronal types in the developing human cerebellar cortex. J Neuropathol Exp Neurol. 1993;52:655–666. doi: 10.1097/00005072-199311000-00013. [DOI] [PubMed] [Google Scholar]
- 36.Katsetos CD, Del Valle L, Geddes JF, Assimakopoulou M, Legido A, Boyd JC, Balin B, Parikh NA, Maraziotis T, de Chadarevian JP, Varakis R, Matsas R, Spano A, Frankfurter A, Herman MM, Khalili K. Aberrant localization of the neuronal class III-tubulin in astrocytomas. Arch Pathol Lab Med. 2001;125:613–24. doi: 10.5858/2001-125-0613-ALOTNC. [DOI] [PubMed] [Google Scholar]
- 37.Martin JA, Forest E, Block JA, Klingelhutz AJ, Whited B, Gitelis S, Wilkey A, Buckwalter JA. Malignant transformation in human chondrosarcoma cells supported by telomerase activation and tumor suppressor inactivation. Cell Growth Differ. 2002;13:397–407. [PubMed] [Google Scholar]
- 38.Ohnishi T, Hiraga S, Izumoto S, Matsumura H, Kanemura Y, Arita N, Hayakawa T. Role of fibronectin-stimulated tumor cell migration in glioma invasion in vivo: clinical significance of fibronectin and fibronectin receptor expressed in human glioma tissues. Clin Exp Metastasis. 1998;16:729–741. doi: 10.1023/a:1006532812408. [DOI] [PubMed] [Google Scholar]
- 39.Albini A, Iwamoto Y, Kleinman HK, Martin GR, Aaronson SA, Kozlowski RN, McEwan RN. A rapid in vitro assay for quantitating the invasive potential of tumor cells. Cancer Res. 1987;47:3239–3245. [PubMed] [Google Scholar]
- 40.Liebermann TA, Nusbaum HR, Razon N, Kris R, Lax I, Sorq H, Whittle MD, Waterfield MD, Ulrich A, Schlessinger J. Amplification, enhanced expression and possible rearrangements of EGF receptor gene in primary human brain tumors of glial origin. Nature. 1985;313:144–147. doi: 10.1038/313144a0. [DOI] [PubMed] [Google Scholar]
- 41.Ekstrand AJ, James CD, Cavanee WK, Sielger B, Pettersson RF, Collins VP. Genes for epidermal growth factor receptor, transforming growth factor alpha and epidermal growth factor and their expression in human gliomas in vivo. Cancer Res. 1991;51:2164–2172. [PubMed] [Google Scholar]
- 42.Thomas CY, Chouinard M, Cox M, Parsons S, Stallings-Mann M, Garcia R, Jove R, Wharen R. Spontaneous activation and signalling by overexpressed epidermal growth factor receptors in glioblastoma cells. Int J Cancer. 2003;104:19–27. doi: 10.1002/ijc.10880. [DOI] [PubMed] [Google Scholar]
- 43.Altaba A, Sanchez P, Dahmane N. GLI and Hedgehog in cancer: tumors, embryos and stem cells. Nat Rev Cancer. 2002;2:361–372. doi: 10.1038/nrc796. [DOI] [PubMed] [Google Scholar]
- 44.Sehgal A. Molecular changes during the genesis of human gliomas. Semin Surg Oncol. 1998;14:3–12. doi: 10.1002/(sici)1098-2388(199801/02)14:1<3::aid-ssu2>3.0.co;2-f. [DOI] [PubMed] [Google Scholar]


