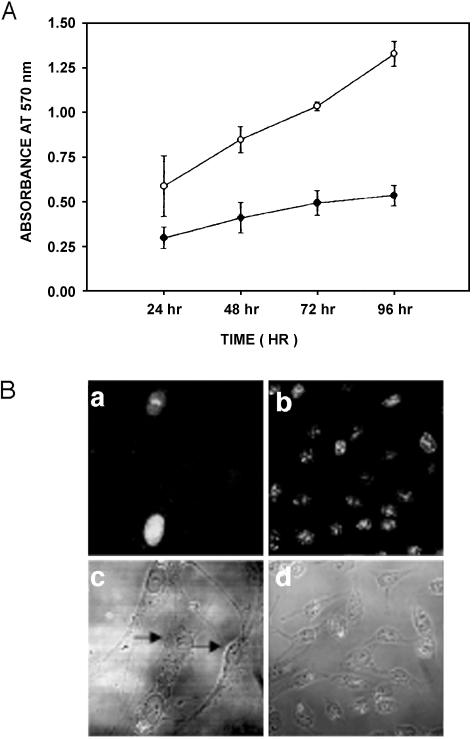
Figure 2.
Cell proliferation determined by MTT assay. (A) Graphical representation over a period of 96 hours in both cell lines HNGC-1 and HNGC-2. HNGC-2 is a fast-growing cell line and is in the exponential phase of growth even at 96 hours; its growth plot is represented by hollow circles. The growth of HNGC-1 cells is slow and plateaus at 48 hours; its growth plot is represented by open circles. The growth plot is representative of three similar experiments done independently at two different passages (HNGC-1, p8 and p18; and HNGC-2, p50 and p60). (B) Represents the growth potential of both cell lines assessed by their reactivity to Ki67, a proliferation marker. Only 50% of the cells stain for Ki67 in the HNGC-1 cell line (a), whereas in the case of HNGC-2 cell line, almost 80% of cells are Ki67+ (b). A corresponding phase contrast micrograph of the two cell lines is shown for HNGC-1 in (c) and for HNGC-2 in (d), respectively. The arrow heads in (c) point toward cells derived from HNGC-1 that are nonimmunoreactive to Ki67. A similar percentage of Ki67 positivity is obtained in three independent experiments.

