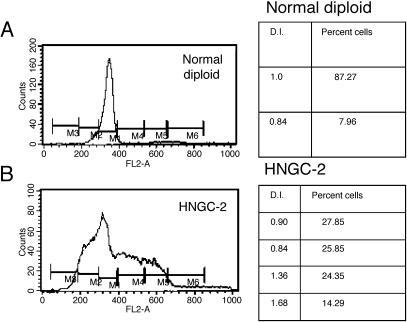
Figure 3.
Estimation of ploidy and DNA content of HNGC-2 by flow cytometric analyses. Normal human lymphocytes were used as reference to determine the relative fluorescence intensity for 2n population with DI = 1 (A). The distribution of HNGC-2 population with varying DNA indices with hypodiploidy and hyperdiploidy is shown in (B).

