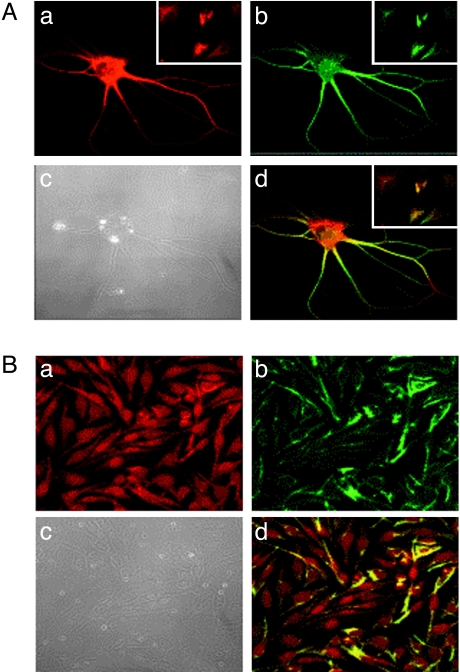
Figure 6.
Double immunofluorescence labeling of cells. (A) HNGC-1's and (B) HNGC-2's double immunofluorescence labeled with MAP-2 and S100β antibodies coexpress neuronal and glial markers and are visualized using fluoresceinated rhodamine-conjugated anti-rabbit IgG and anti-mouse IgG FITC. Cells independently immunoreactive for MAP-2 stain red (a) and those immunoreactive for S100 stain green (b) whereas colocalization of both molecules MAP-2 and S100 to the single cell resulted in yellow color, as shown in overlay images (d). Note that all cells are dual positive in case of HNGC-1 (shown in insert—d) as well as in HNGC-2 (d). Original magnification, x 63. A phase contrast micrograph of cells of HNGC-1 and HNGC-2 is shown in (c).

