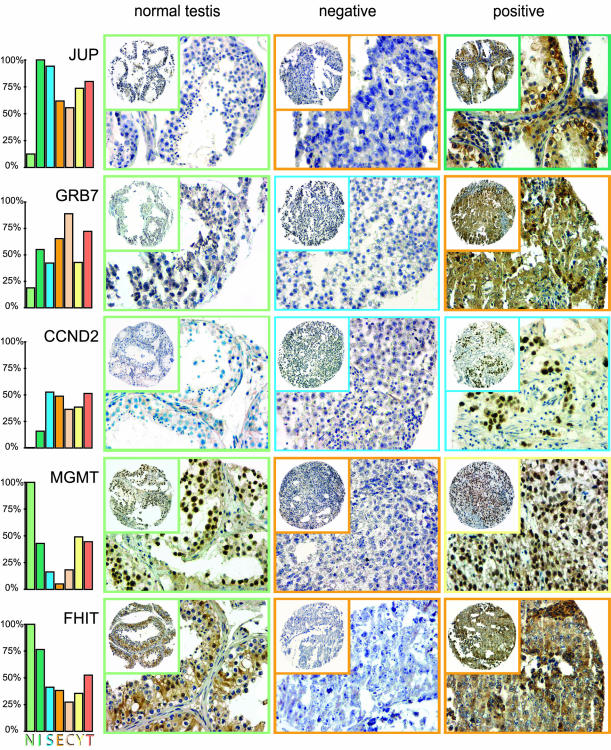
Figure 1.
TGCT tissue microarray, immunohistochemical staining. For each of the five analyzed proteins, representative tissue cores of one normal testicular parenchyma, one negative neoplasm, and one positive neoplasm are shown. The colored squares designate the histological subtype of each sample specified by the color code of the histograms. The histograms, again, indicate the frequencies of positive cases for each histological subtype. N=normal spermatocytic germ cells; I = intratubular germ cell neoplasia unclassified (carcinoma in situ); S = seminoma; E = embryonal carcinoma; C = choriocarcinoma; Y = yolk sac tumor; T = teratoma.

