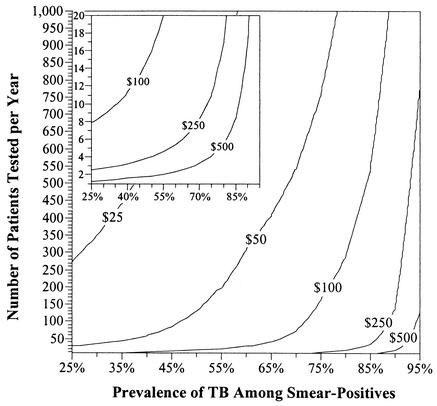
FIG. 1.
MTD cost-effectiveness, by TB prevalence, patient load, and isolation cost. Each isocontour represents the daily marginal cost of respiratory isolation needed to offset the costs of a hypothetical MTD testing program at a laboratory with a given number of patients tested per year (y axis) and relative prevalence of pulmonary TB among patients with AFB smear-positive respiratory specimens (x axis). Areas above a given isocontour represent those situations in which the implementation of MTD is expected to be cost-saving relative to the standard of care. The inset at the upper left details MTD cost-effectiveness in laboratories processing small numbers of smear-positive specimens on an annual basis.

