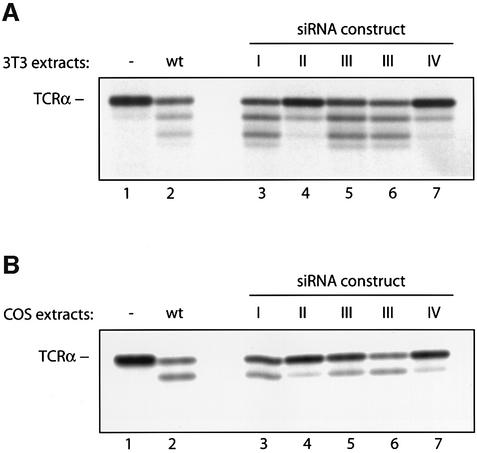
Fig. 4. The deglycosylation activity observed in 3T3 and COS-1 cells is encoded by PNG1 mRNA. PNG1 knockdowns were generated in 3T3 (A) and COS-1 (B) cells as described in Materials and methods. Extracts from generated cell lines were tested in the deglycosylation assay, using [35S]methionine-labeled TCRα as a substrate. In (A), 400 µg of 3T3 cell extracts were used, in (B) 600 µg of COS-1 cell extracts. Lane 1: TCRα substrate incubated without cell extracts. Lane 2: TCRα incubated with wild-type cell extracts. Lanes 3–7: TCRα substrate incubated with extracts from PNG1 knockdown cell lines, infected with constructs I–IV (see Materials and methods for details). Note that extracts from cells infected with knockdown construct III were used from two independent DNA isolates, since the complete nucleotide sequence of this construct could not be determined. The N-glycanase activity observed in the wild-type COS extracts is lower than that seen in Figure 1, lane 5, because for the experiment shown here the extracts have been frozen prior to performing the deglycosylation assay.

An official website of the United States government
Here's how you know
Official websites use .gov
A
.gov website belongs to an official
government organization in the United States.
Secure .gov websites use HTTPS
A lock (
) or https:// means you've safely
connected to the .gov website. Share sensitive
information only on official, secure websites.
