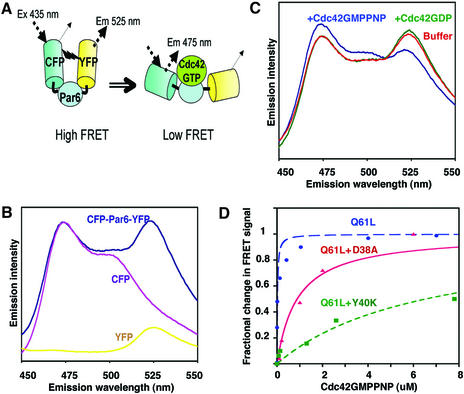
Fig. 7. Par6 B conformational biosensor. (A) Schematic of the biosensor structure, in the bound and unbound states, and emission spectra of the biosensor, CFP alone and YFP alone, excited at 433 nm. (B) Emission spectra of the CFP–Par6–YFP biosensor and of separated CFP and YFP. (C) Emission spectra of the biosensor and of CFP–YFP, each incubated with either Cdc42·GMPPNP or Cdc42·GDP (1 µM). (D) Titration curve of the Par6 biosensor incubated with varying concentrations of Q61L Cdc42 or the indicated mutants (in a Q61L background), all loaded with GMPPNP. The binding curve was fitted to the data assuming a single independent binding site, using Kaleidagraph software.

An official website of the United States government
Here's how you know
Official websites use .gov
A
.gov website belongs to an official
government organization in the United States.
Secure .gov websites use HTTPS
A lock (
) or https:// means you've safely
connected to the .gov website. Share sensitive
information only on official, secure websites.
