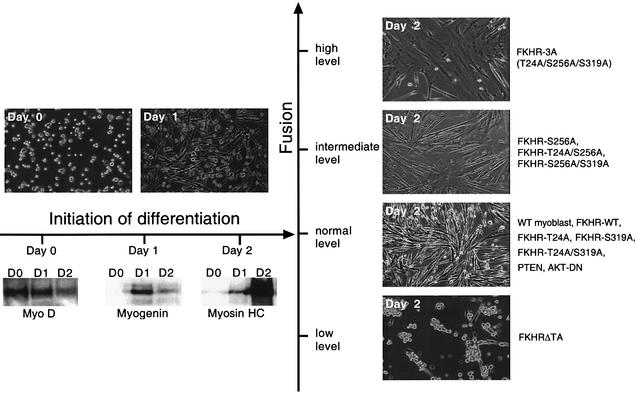
Fig. 6. Summary of myoblast phenotypes generated by expression of different FKHR mutants. Top left panels show the differentiation of wild-type, FKHR mutants, PTEN- and DN-Akt-expressing myoblasts at 0 and 24 h of differentiation. No difference in the extent of fusion between any of these populations was observed. Lower left panels show the temporal expression of early (MyoD), intermediate (myogenin) and late (myosin heavy chain) myogenic markers during 2 days of differentiation, which was the same for all samples. Right panels show the complete range of fusion phenotypes generated by the different FKHR mutants.

An official website of the United States government
Here's how you know
Official websites use .gov
A
.gov website belongs to an official
government organization in the United States.
Secure .gov websites use HTTPS
A lock (
) or https:// means you've safely
connected to the .gov website. Share sensitive
information only on official, secure websites.
