Figure 2.
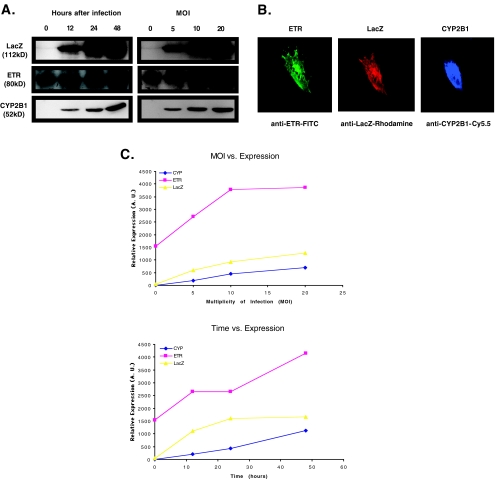
(A) Correlation of transgene expression in cells infected with EZ-ETR-P450 amplicon. Gli36∂EGFR cells were infected with amplicon containing three transgenes. At the indicated times or MOI, cells were harvested and lysates subjected to analysis by Western blot to confirm expression of transgenes. Blots were treated and signal-analyzed using NIH image as described in Materials and Methods. These data are plotted in (C). When protein expression was assessed at varying times after infection, a single MOI of 1 was used (representative data, n=3). (B) Expression of three cDNA after infection with EZ-ETR-P450 amplicon in each cell. Cells were fixed and analyzed using three different antibodies specific for each protein product. Complexes were then visualized using a second antibody conjugated to one of three different fluorochromes, each emitting at different wavelengths. All three gene products were expressed in all cells observed. Presented is a representative cell from an experiment (n=3). (C) Graphical analysis of Western blot from (A). The ECL signal from (A) was captured on to photographic film, scanned into the computer, and the resulting electronic figure analyzed using NIH Image.

