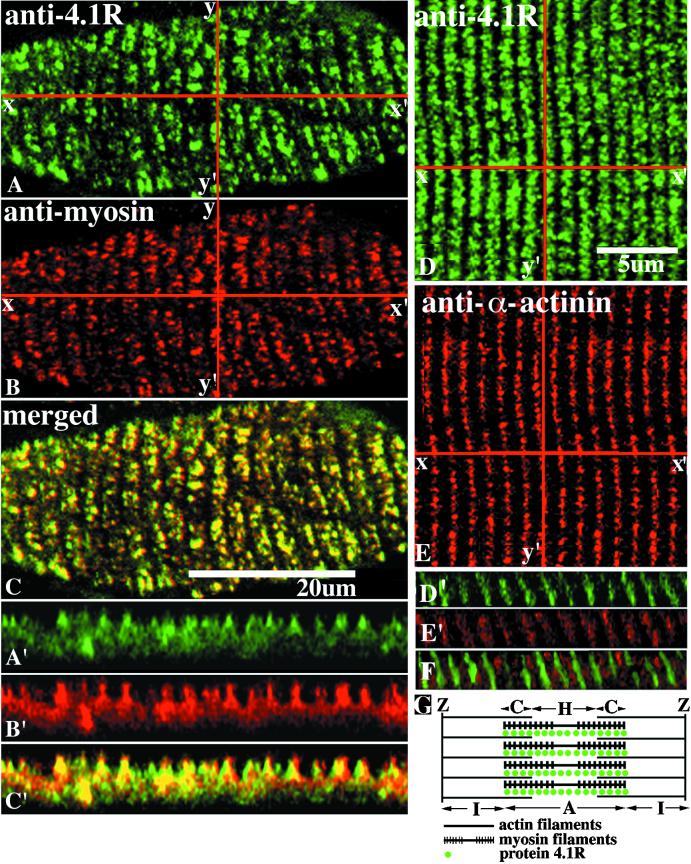
Figure 5.
Characterization of 4.1R distribution relative to markers for the A-band and Z-disk by three-dimensional confocal microscopy. Coincident staining between myosin and 4.1R indicated that the latter is in register with A-bands (A–C and A′–C′). No apparent areas of colabeling between 4.1R and α-actinin (Z-disk marker; D, E, and D′–F) were observed. (G) Schematic presentation of the presence of 4.1R along the A-band; for simplicity of presentation, only the myosin and actin filaments are shown. Z, Z-discs, defining the limits of a sarcomere; I, I-band, consisting of actin filaments and associated proteins; A, A-band, composed mainly of myosin along with portions of overlapping actin filaments present at C-zones; H, H-zone, residing in the center of A-band. Magnification, ×100.

