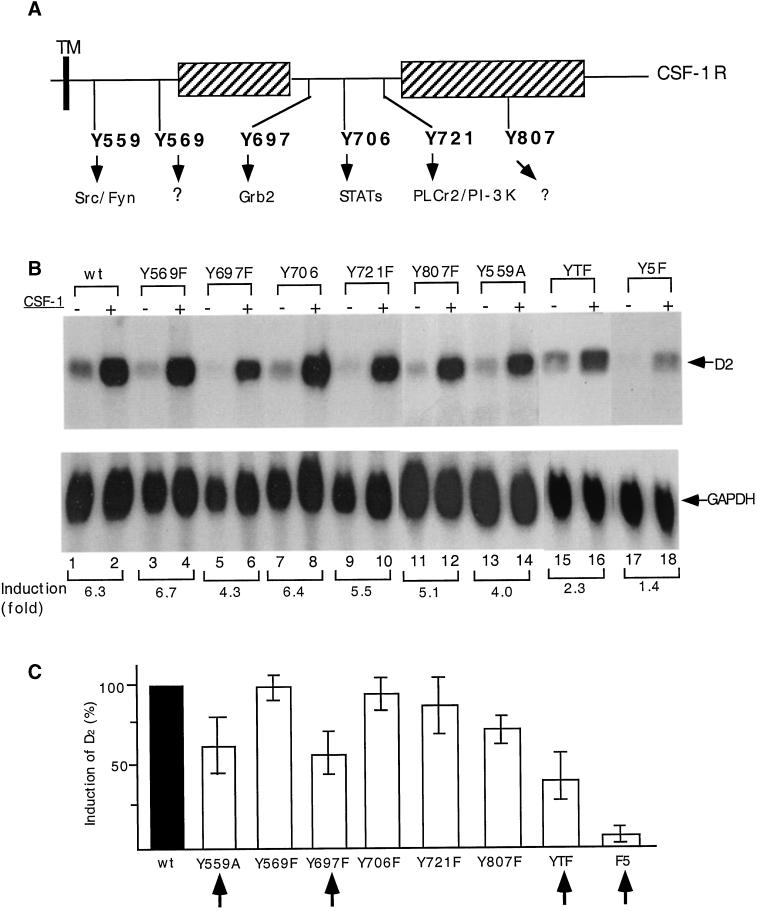
Figure 2.
Effects of CSF-1R autophosphorylation mutations on CSF-1–induced cyclin D2 expression. FDC-P1 cells expressing the wild-type and the various mouse CSF-1R mutants (A) were starved in CSF-1–free medium with 10% fetal bovine serum for 16–18 h and untreated or treated with mouse CSF-1 (4.4 nM) for 5 h. Total RNA was isolated and analyzed for D2 (B, top) expression. GAPDH expression (B, bottom) was included as a control for RNA loading. Relative intensities of the bands were measured by scanning densitometry of each of the individual bands. Fold increases were given to each cell line after calibration with their corresponding GAPDH levels: band+/band− X GAPDH−/GAPDH+ = Fold. “+” and “−” represent “with” and “without” CSF-1 stimulation, respectively. Percentages of induction of D2 by the various CSF-1R mutants in reference to the wild-type CSF-1R (100%) were based on results from three independent experiments (C), and data shown are mean ±SE of the scanning densitometry data of the three experiments.

