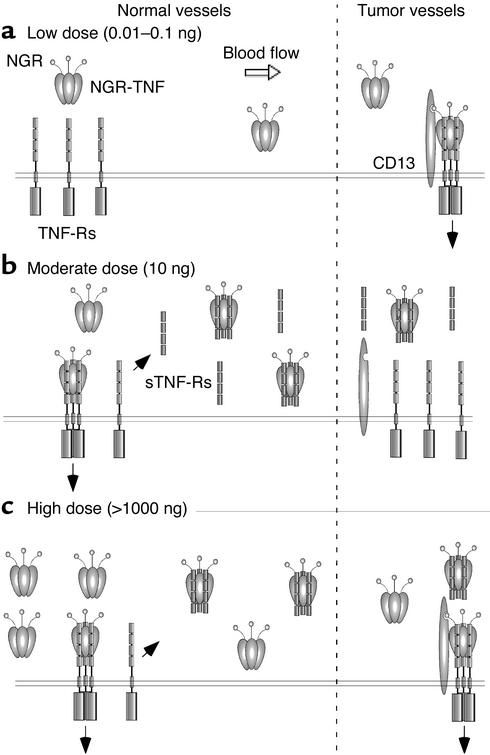
Figure 8.
Schematic representation of the hypothetical interactions of low (a), moderate (b), and high (c) doses of NGR-TNF with soluble and membrane receptors in normal vessels (CD13-negative) and in tumor-associated vessels (CD13-positive). Black arrows indicate TNF receptor signaling or extracellular domain shedding.

