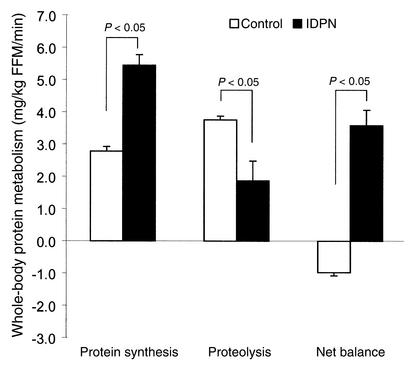
Figure 5.
Whole-body protein components during HD, comparing control (white bars) and IDPN (black bars). Units are in milligrams per kilogram of FFM per minute. Significant differences were observed for all components of whole-body protein homeostasis during this period. There were no differences during predialysis or postdialysis periods (refer to Table 3).

