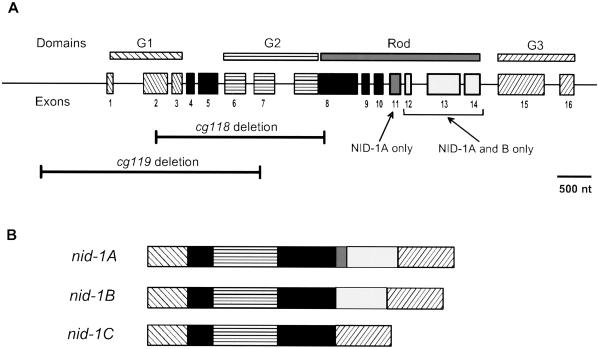
Figure 1.
Structure of the C. elegans nid-1 nidogen gene. (A) Exons are indicated as boxes with numbers below. The nid-1A-specific exon 11 is colored dark gray, and the nid-1A– and B–specific exons 12–14 are colored light gray. The extents of the G1, G2, and G3 globular domains and the rod domain are indicated at the top of the figure. The extents of the cg118 and cg119 deletions are shown below the figure. (B) The structures of the three alternatively spliced transcripts generated from the nid-1 gene.

