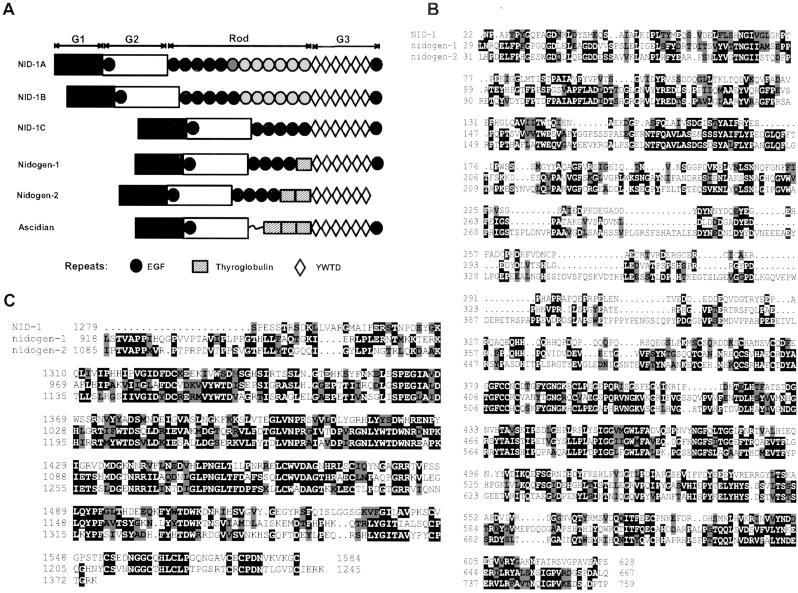
Figure 2.
Comparisons of nidogen protein structures and sequences. (A) Domain structures of C. elegans NID-1, mouse nidogen-1 (Mann et al., 1989), human nidogen-2 (Kohfeldt et al., 1998), and Ascidian nidogen (Nakae et al., 1993). Domains are represented as follows: ▪, G1; □, G2; ○, EGF; ▨, thyroglobulin; ⋄, YWTD motif (Springer, 1998). EGF repeats that are present in all forms are colored black, the NID-1A-specific EGF is dark gray, and the NID-1A– and B–specific EGFs are light gray. The extents of domains for NID-1A are indicated at the top. (B) Sequence alignment of the G1 through G2 domains of NID-1, mouse nidogen-1, and human nidogen-2. Identical residues are shown as white letters on black background; similar residues are black letters on gray background. Levels of sequence identity and similarity are presented in Table 1. (C) Sequence alignment of the G3 domains of NID-1, mouse nidogen-1, and human nidogen-2. Residues are highlighted as described for B.

