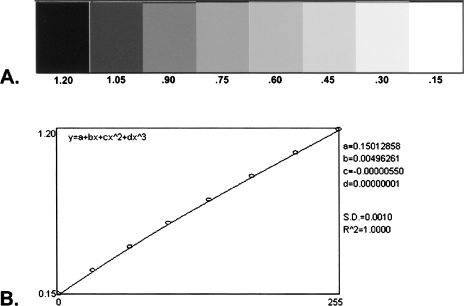
Figure 2.
Step tablet and standard curve. (A) Eight-step gray scale step tablet and (B) standard curve generated from the step tablet shown in (A) used as a reference standard for the signal intensities of gene transcripts measured by RT-PCR and Northern blot analysis. The standard curve line equation and constant values are also shown in (B).

