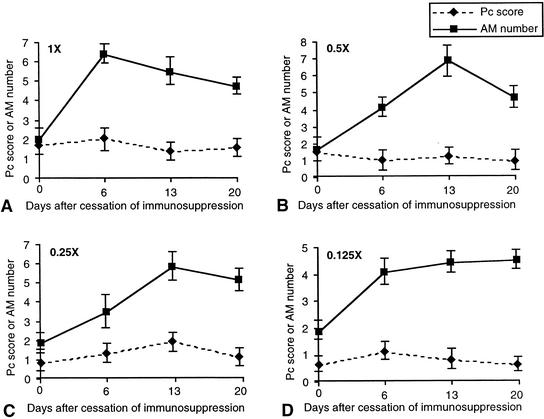
FIG. 5.
Correlation of P. carinii (Pc) burden with alveolar macrophage (AM) number during recovery from P. carinii pneumonia. The symbols and scales are the same as those of Fig. 1. All numbers shown are the averages of results for three rats in the same experimental group (error bars, standard deviations). Immunosuppressed rats were inoculated at day 0 with different loads of P. carinii: 7.8 × 10⁶ trophozoites (1 times the normal load) (A), 3.9 × 10⁶ trophozoites (0.5 times the normal load) (B), 1.95 × 10⁶ trophozoites (0.25 times the normal load) (C), and 9.8 × 10⁴ trophozoites (0.125 times the normal load) (D). These rats were allowed to recover their immunity by cessation of immunosuppression starting on day 21.

