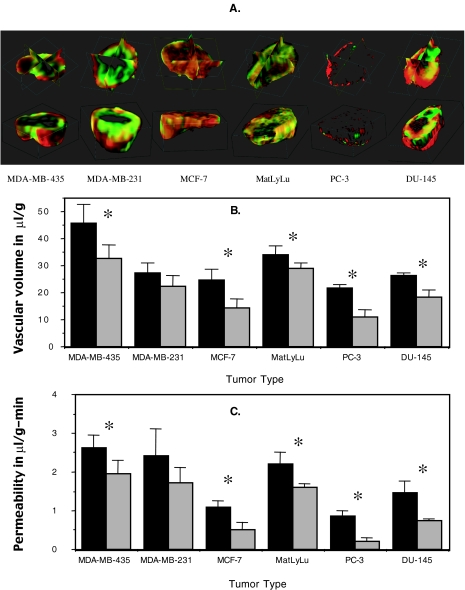
Figure 4.
Vascular volume and permeability “mismatch” characteristics of breast and prostate cancer tumor models. Representative red and green fusion maps for each of the tumor models are shown in (A); red corresponds to vascular volume, green to permeability. The mean value of the highest 25% values of vascular volume (■), and the mean vascular volumes spatially corresponding to the highest 25% values of permeability ( ) are shown in (B). The mean value of the highest 25% of permeability values (■), and the permeability spatially corresponding to the highest 25% values of vascular volume (
 ) are shown in (C). A significant difference (P<.05) was observed for all the tumor models. The only exception to this was for the MDA-MB-231 tumor group.

