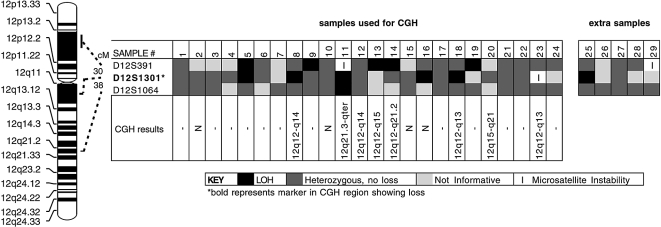
Figure 2.
LOH analysis using chromosome 12 markers in 29 ACCs. The microsatellite markers used are listed on the left, in order from pter (top) to qter (bottom). The results of the assays are shown as indicated in the key. The black squares indicate deleted loci. Deletions were found in 10 of 29 cancers (34%). The majority of losses were found at the D12S1301 marker, having loss in 6 of 10 cancers with deletions (60%) followed by the D12S391 marker having loss in 5 of 10 cancers with deletions (50%). CGH results are from Table 1.

