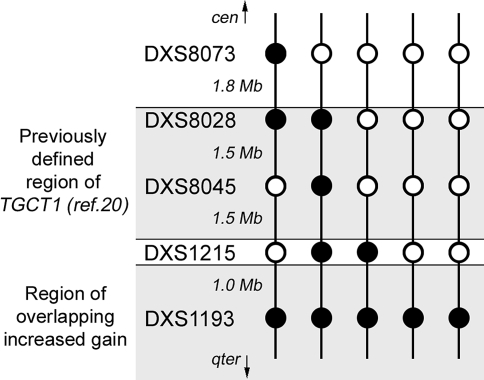
Figure 4.
Closing in on TGCT1. This panel shows the pattern of the five tumors with breakpoints in their X marker peak heights, compared to their reference peak heights. The filled circles indicate markers with increased gain compared to their neighboring markers (open circles). DXS1193 was the only marker showing increased gain in all these tumors.

